In financial market analysis, using indicators is one of the most important tools for understanding price behavior. In the ANAKO AI platform, the indicators section helps users examine the market situation using a set of technical indicators.
On this page, users can view all the important market indicators for each trading symbol.
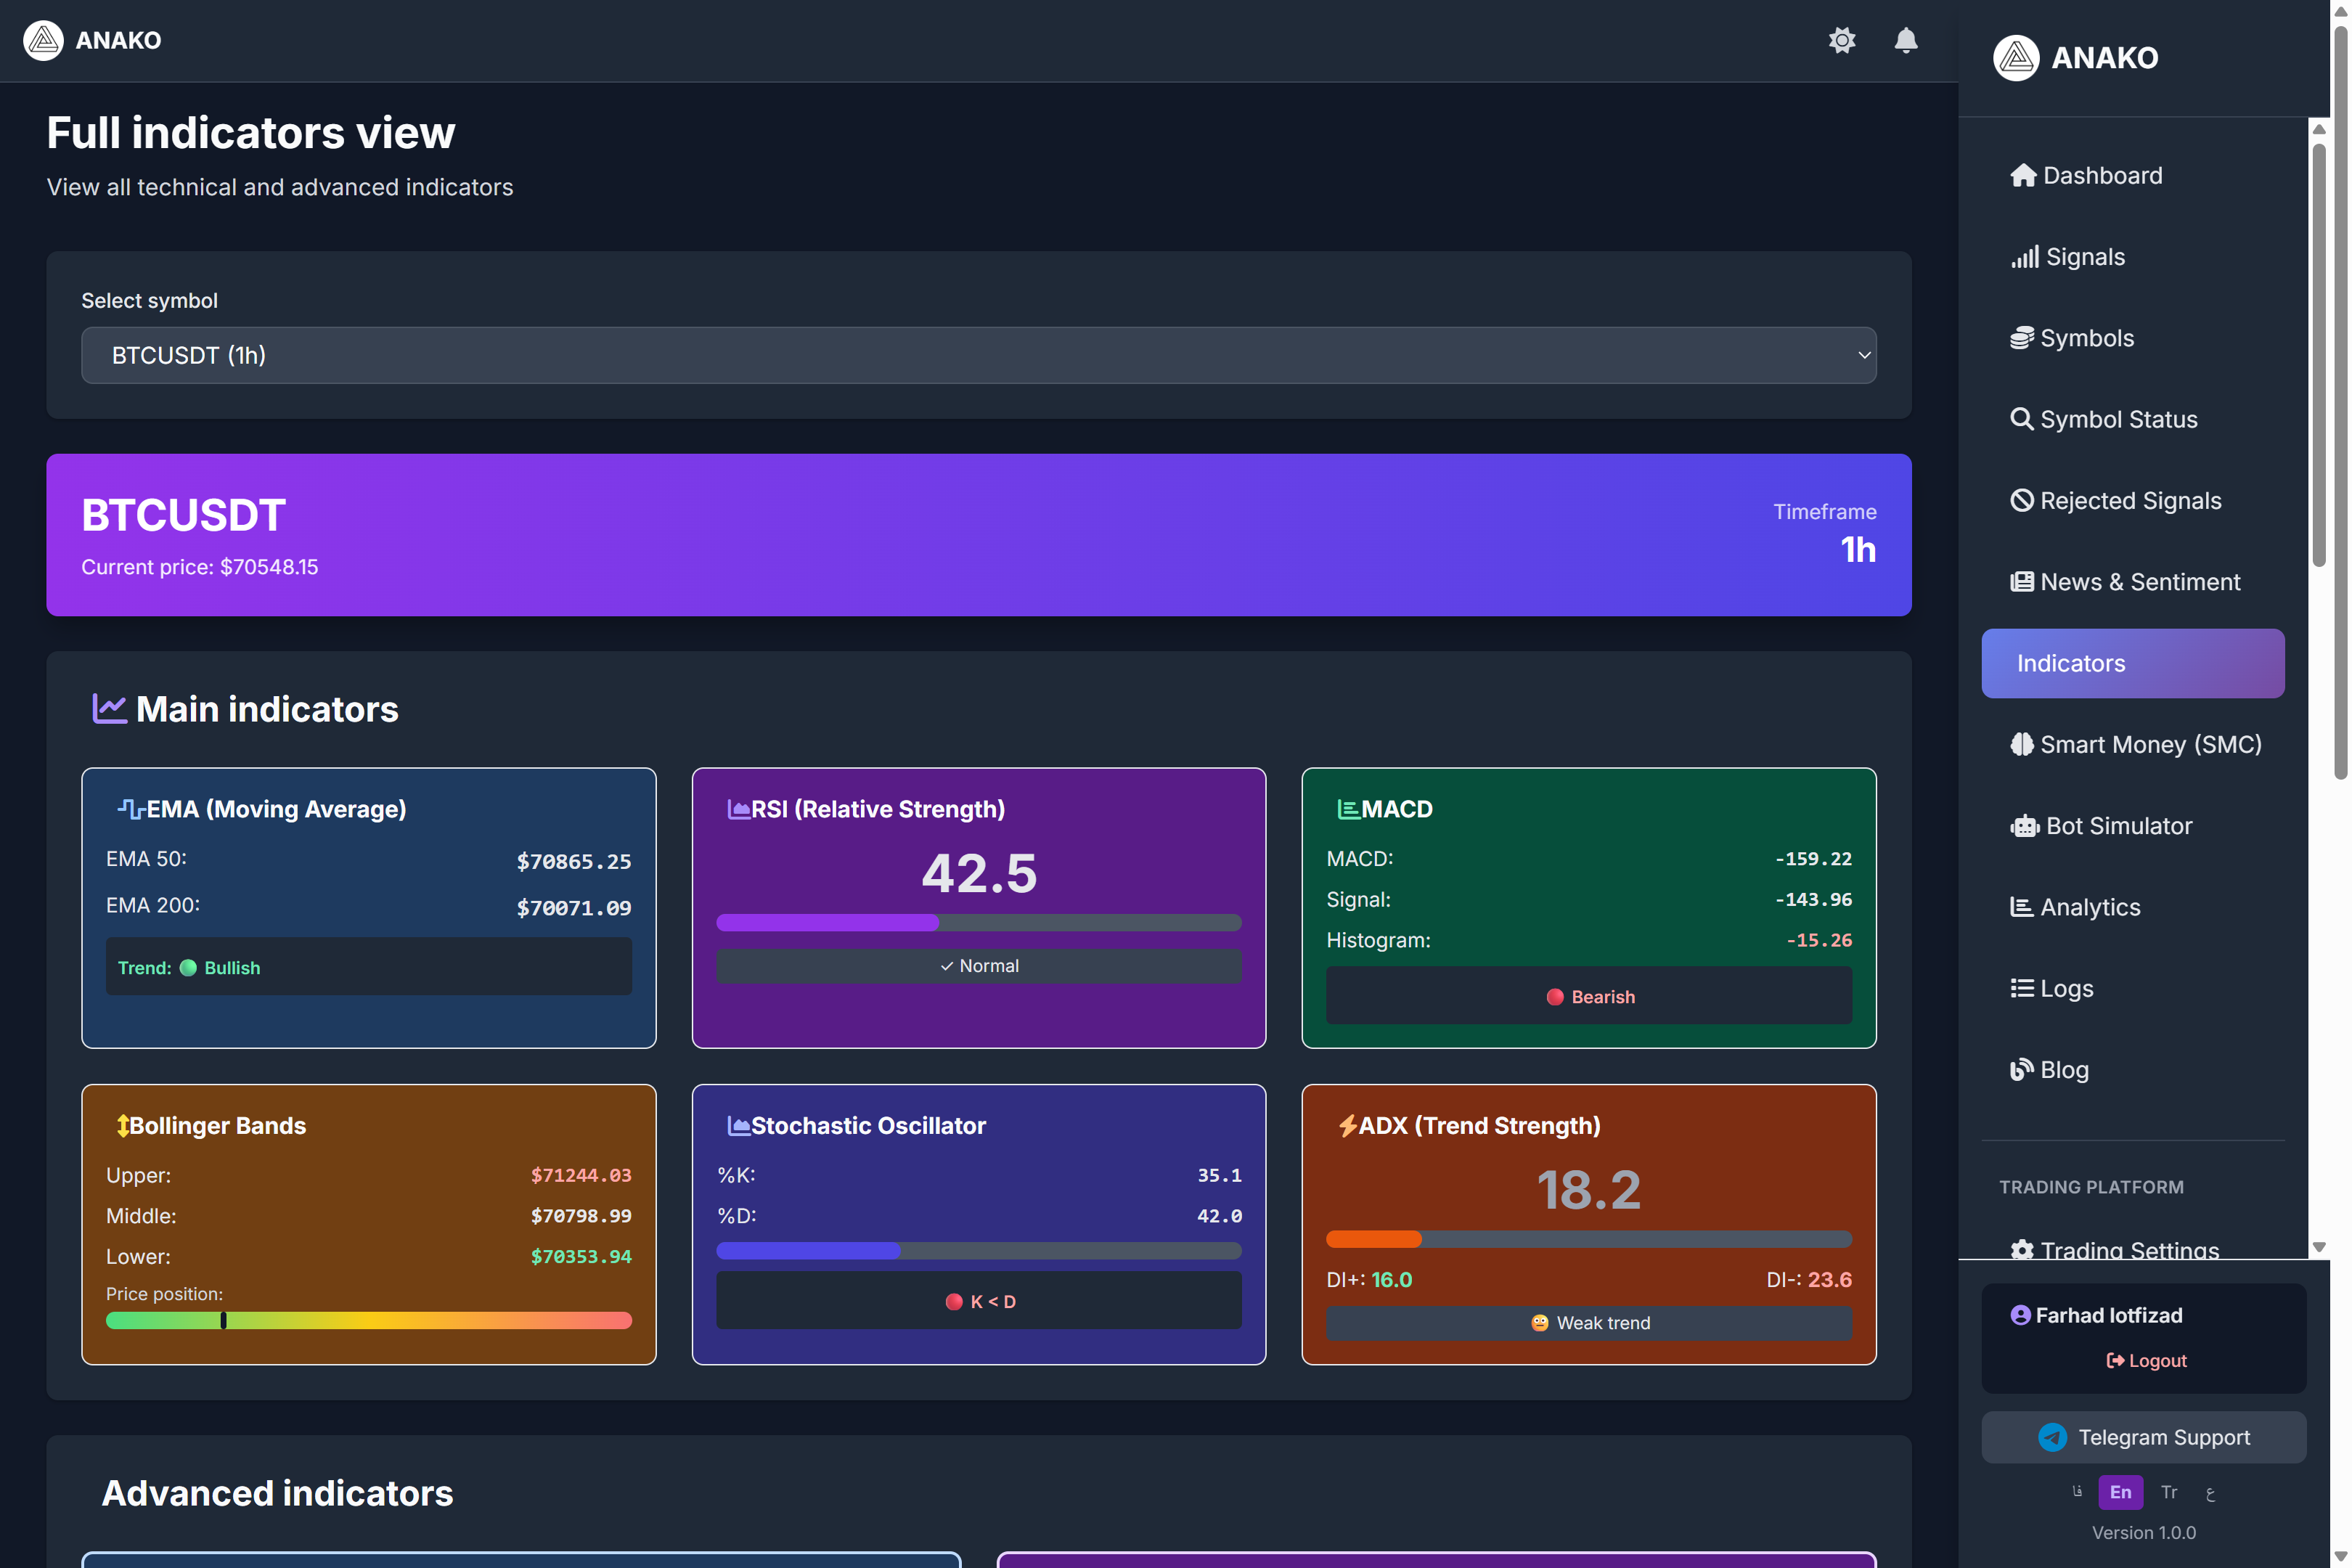
Select Trading Symbol
At the top of the page, the Select symbol option is available.
Here you can choose your desired currency pair.
Example:
BTCUSDT (1h)
This means the analysis is related to Bitcoin in the one-hour timeframe.
Current Market Price
The real-time asset price is displayed at the top of the page.
Example:
Current price
$70548.15
This number indicates the last recorded price in the market.
Main Indicators
In this section, the most important technical indicators are displayed.
These indicators help traders examine market trends, price movement strength, and potential entry or exit points.
EMA – Exponential Moving Average
EMA or Exponential Moving Average is one of the most commonly used trend analysis tools.
Two values are displayed in this section:
EMA 50
EMA 200
These two averages are usually used to identify market trends.
Example:
EMA50
$70865
EMA200
$70071
When the short-term EMA is above the long-term EMA, the market is generally considered to be in an upward trend.
In this example, the system identifies the market status as:
Bullish
.
RSI – Relative Strength Index
RSI indicates whether the market is in a state of overbought or oversold.
The RSI range is between 0 and 100.
Usually:
Above 70 → Overbought
Below 30 → Oversold
In the example image:
RSI = 42.5
This value indicates the market is in a normal state.
MACD – Momentum Indicator
MACD is used to detect trend strength and changes in market direction.
Three values are displayed in this section:
MACD
Signal
Histogram
In the example image, the status is:
Bearish
which can indicate a decrease in upward momentum.
Bollinger Bands
Bollinger Bands show the price volatility range.
There are three main levels:
Upper band
Middle band
Lower band
In the image, the price is in the middle range, indicating that the market is moving in equilibrium.
Stochastic Oscillator
This indicator is used to identify short-term market momentum.
It has two important values:
K
D
In the image, the value of K is lower than D, which can be a sign of weakness in the upward movement.
ADX – Trend Strength
ADX indicates how strong the market trend is.
Important values:
Less than 20 → Weak trend
Between 20 and 40 → Moderate trend
Above 40 → Strong trend
In the example image:
ADX = 18.2
This value indicates the market trend is weak.
Advanced Indicators
In this section, more advanced tools for market analysis are presented.
Volume Analysis
This section reviews information related to trading volume.
Displayed items:
Current volume
Average volume
Volume ratio
In the image, the volume ratio is:
0.45
which indicates the trading volume is below the market average.
Also, the OBV status is shown as:
Distribution
which can be a sign of selling pressure in the market.
Support and Resistance
In this section, the most important market support and resistance levels are displayed.
Example:
Resistance 1
$73913
Resistance 2
$71338
Support 1
$70494
These levels are usually areas where the market might react.
Fibonacci Levels
Fibonacci is one of the popular tools for identifying possible price correction points.
Several important levels are displayed in this section:
0.236
0.382
0.5
0.618
0.786
These levels are usually used in technical analysis to find price reversal points.
Why is combining indicators important?
No single indicator can provide a complete trading decision on its own.
For this reason, the ANAKO AI platform analyzes several different indicators simultaneously to provide a more accurate picture of the market situation.
Combining indicators helps:
Better understand the market trend
Reduce false signals
Make more precise trading decisions