In professional trading, evaluating the performance of an analytical system is as important as the signals themselves. Professional traders always try to monitor the system's performance over time to assess its quality.
For this reason, a section called Analytics & Statistics has been designed in the ANAKO AI platform.
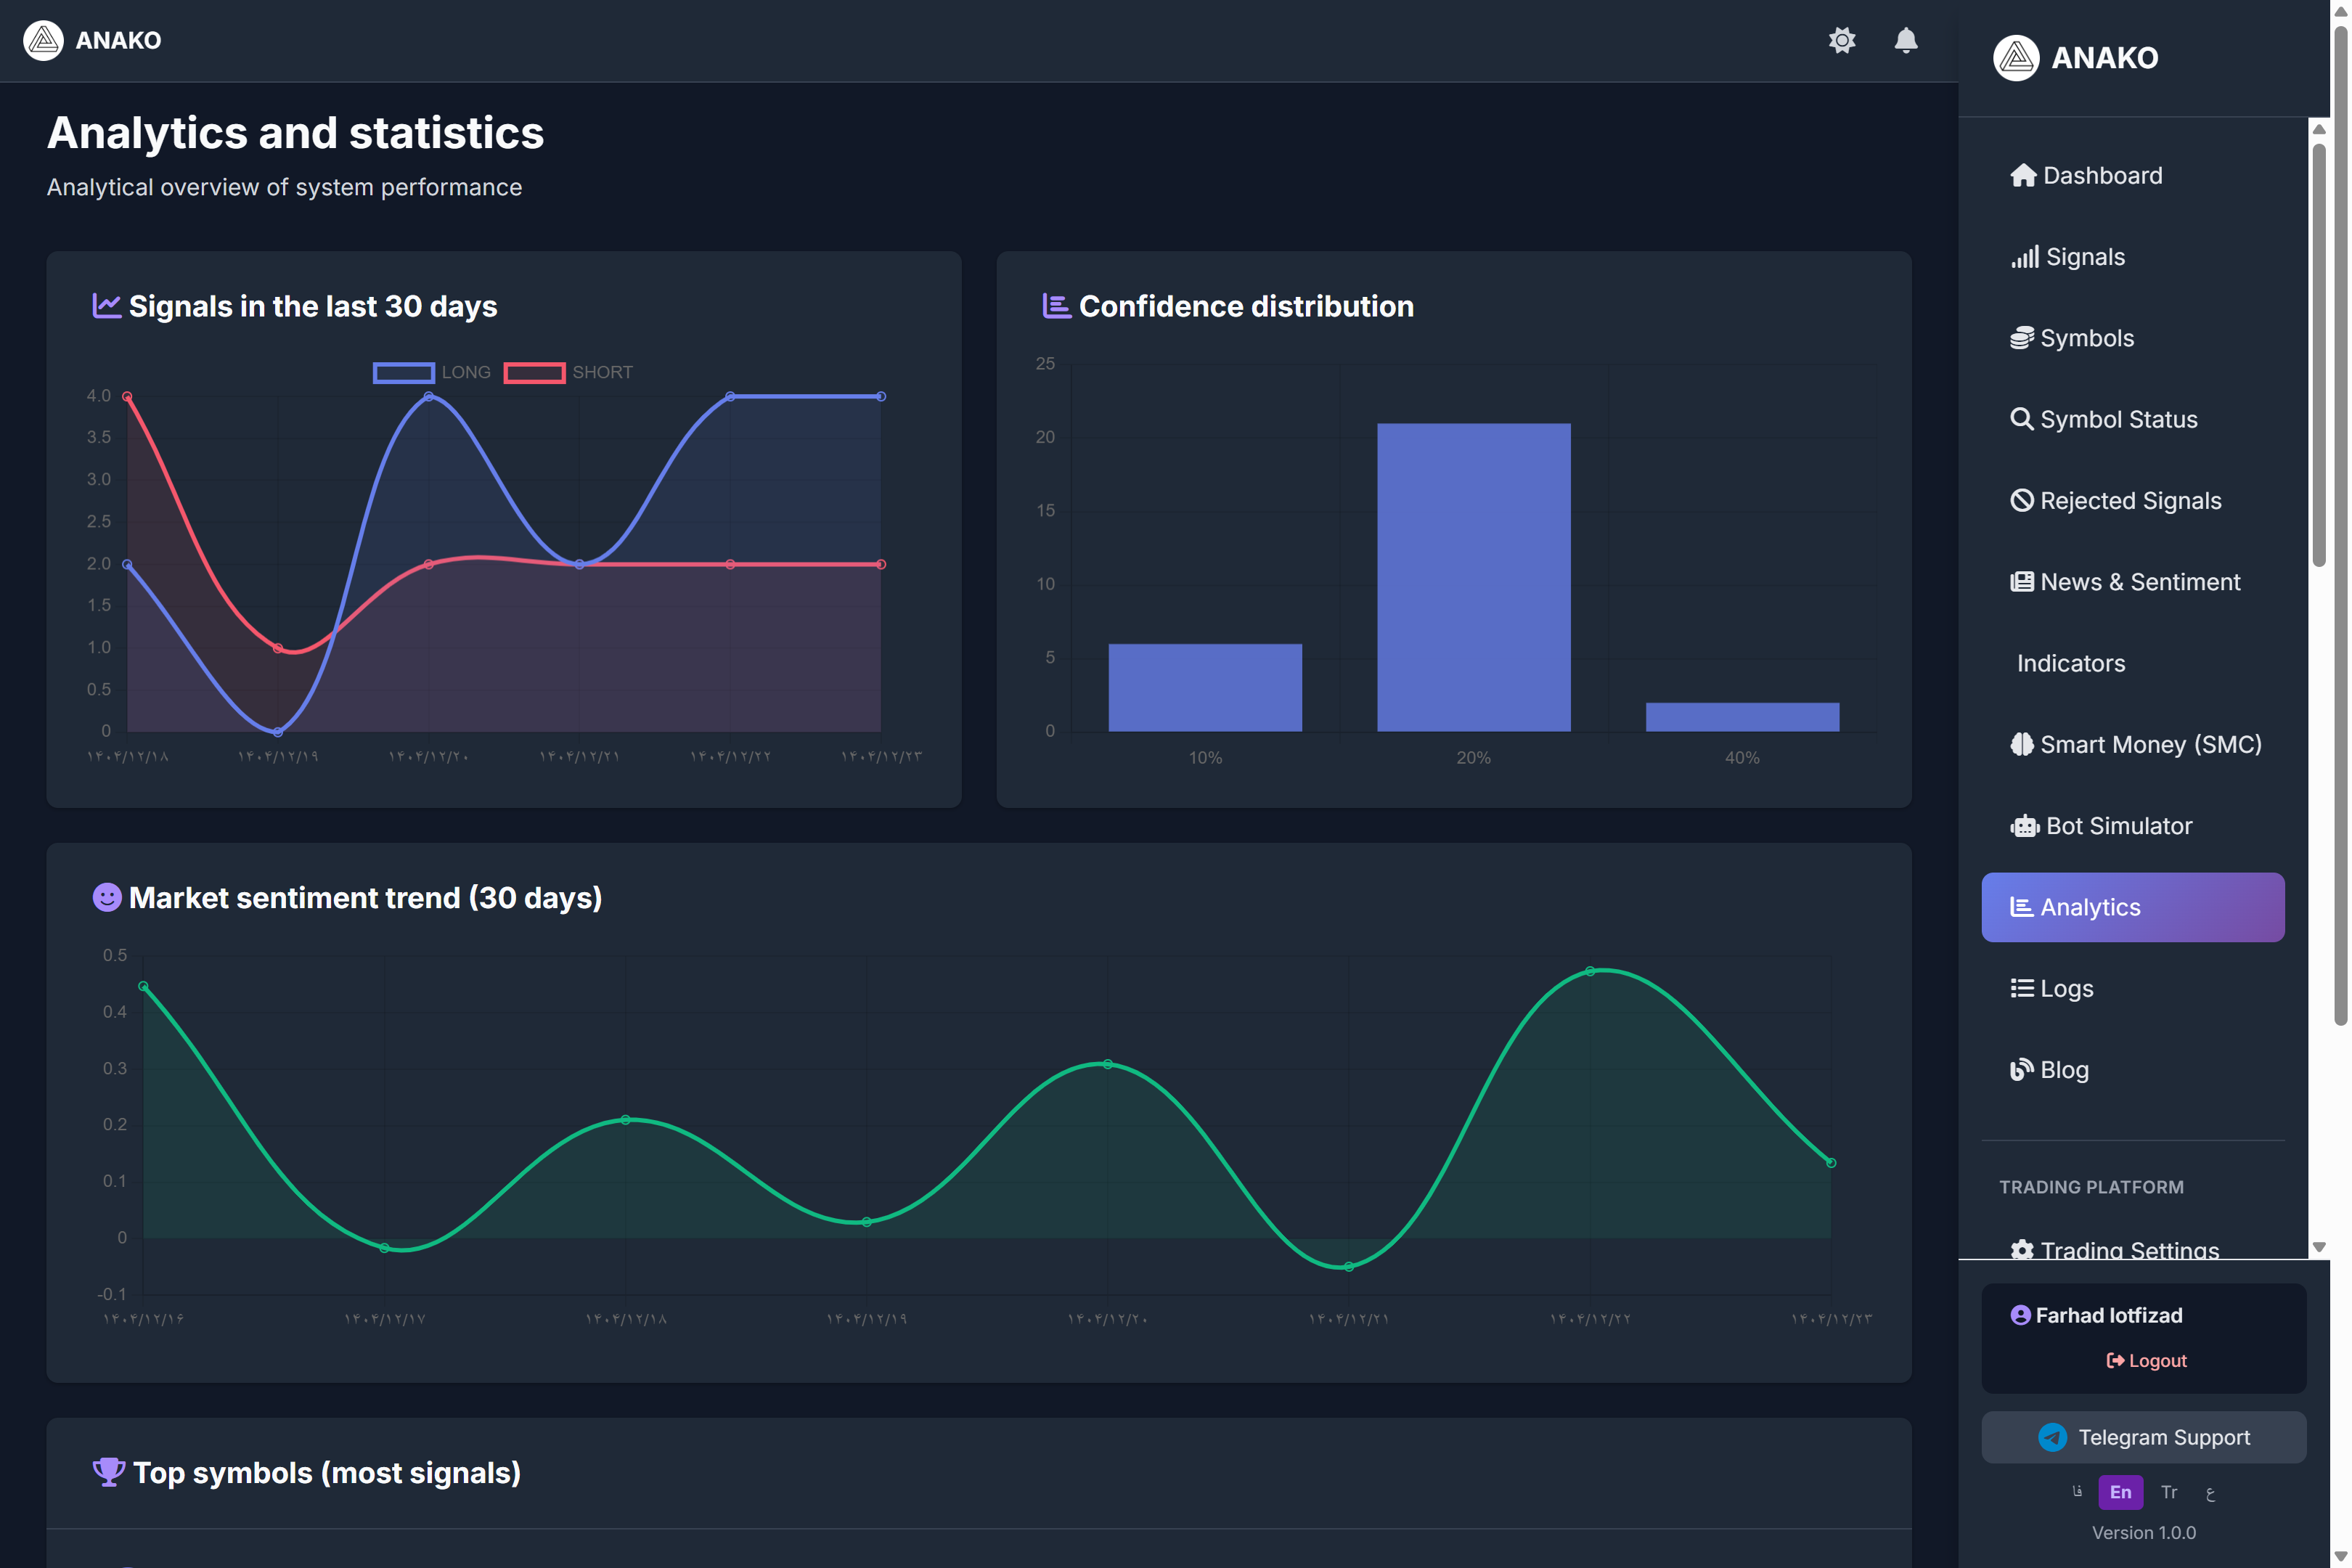
This section provides an analytical view of the system's performance, signals, and market conditions over time.
Signals in the Last 30 Days
This chart shows the number of signals generated in the last 30 days.
Signals are displayed in two categories:
Long
Short
This chart helps traders see under which conditions the system has produced more signals.
Reviewing this chart can indicate:
Whether the market was in a trending state
or whether the market was in a ranging state.
Confidence Distribution
Each signal in the ANAKO system has a Confidence Score.
This score indicates how confident the system is about the generated signal.
The Confidence Distribution chart displays the distribution of these scores.
Example:
Signals with 10% confidence
Signals with 20% confidence
Signals with 40% confidence
This chart helps users better examine the quality of the generated signals.
Market Sentiment Trend
This chart displays the market sentiment trend over the last 30 days.
This data is obtained from analysis of market news and information.
Positive values indicate positive market sentiment.
Negative values indicate negative market sentiment.
This chart helps traders have a better understanding of the market’s psychological atmosphere.
Top Symbols (Most Signals)
This section displays symbols for which the most signals have been generated.
This information helps users understand:
Which assets have attracted more attention from the analytical system.
Usually, these assets have the following characteristics:
High liquidity
Adequate trading volume
Analyzable volatility
Why Is System Performance Analysis Important?
Trading systems cannot be evaluated just by observing a few signals.
To assess the quality of a system, the following should be reviewed:
Performance over time
Number of signals
Success rate
Market conditions
The Analytics section displays this information visually and comprehensibly.
Benefits of the Analytics Section in ANAKO
This section helps users gain a more precise view of the system’s performance.
Using this data, users can:
Review signal performance
Analyze market conditions over time
Make more informed trading decisions.