Training on the Smart Money (SMC) Section in the ANAKO AI Platform
2026/03/15 10:44
One of the most advanced market analysis methods in recent years is Smart Money Concepts (SMC). This analysis style attempts to identify the behavior of major market players such as banks, financial institutions, and whales.
On the ANAKO AI platform, the Smart Money Concepts section automatically analyzes and displays a set of important tools from this analytical style.
Market Bias – Overall Market Direction
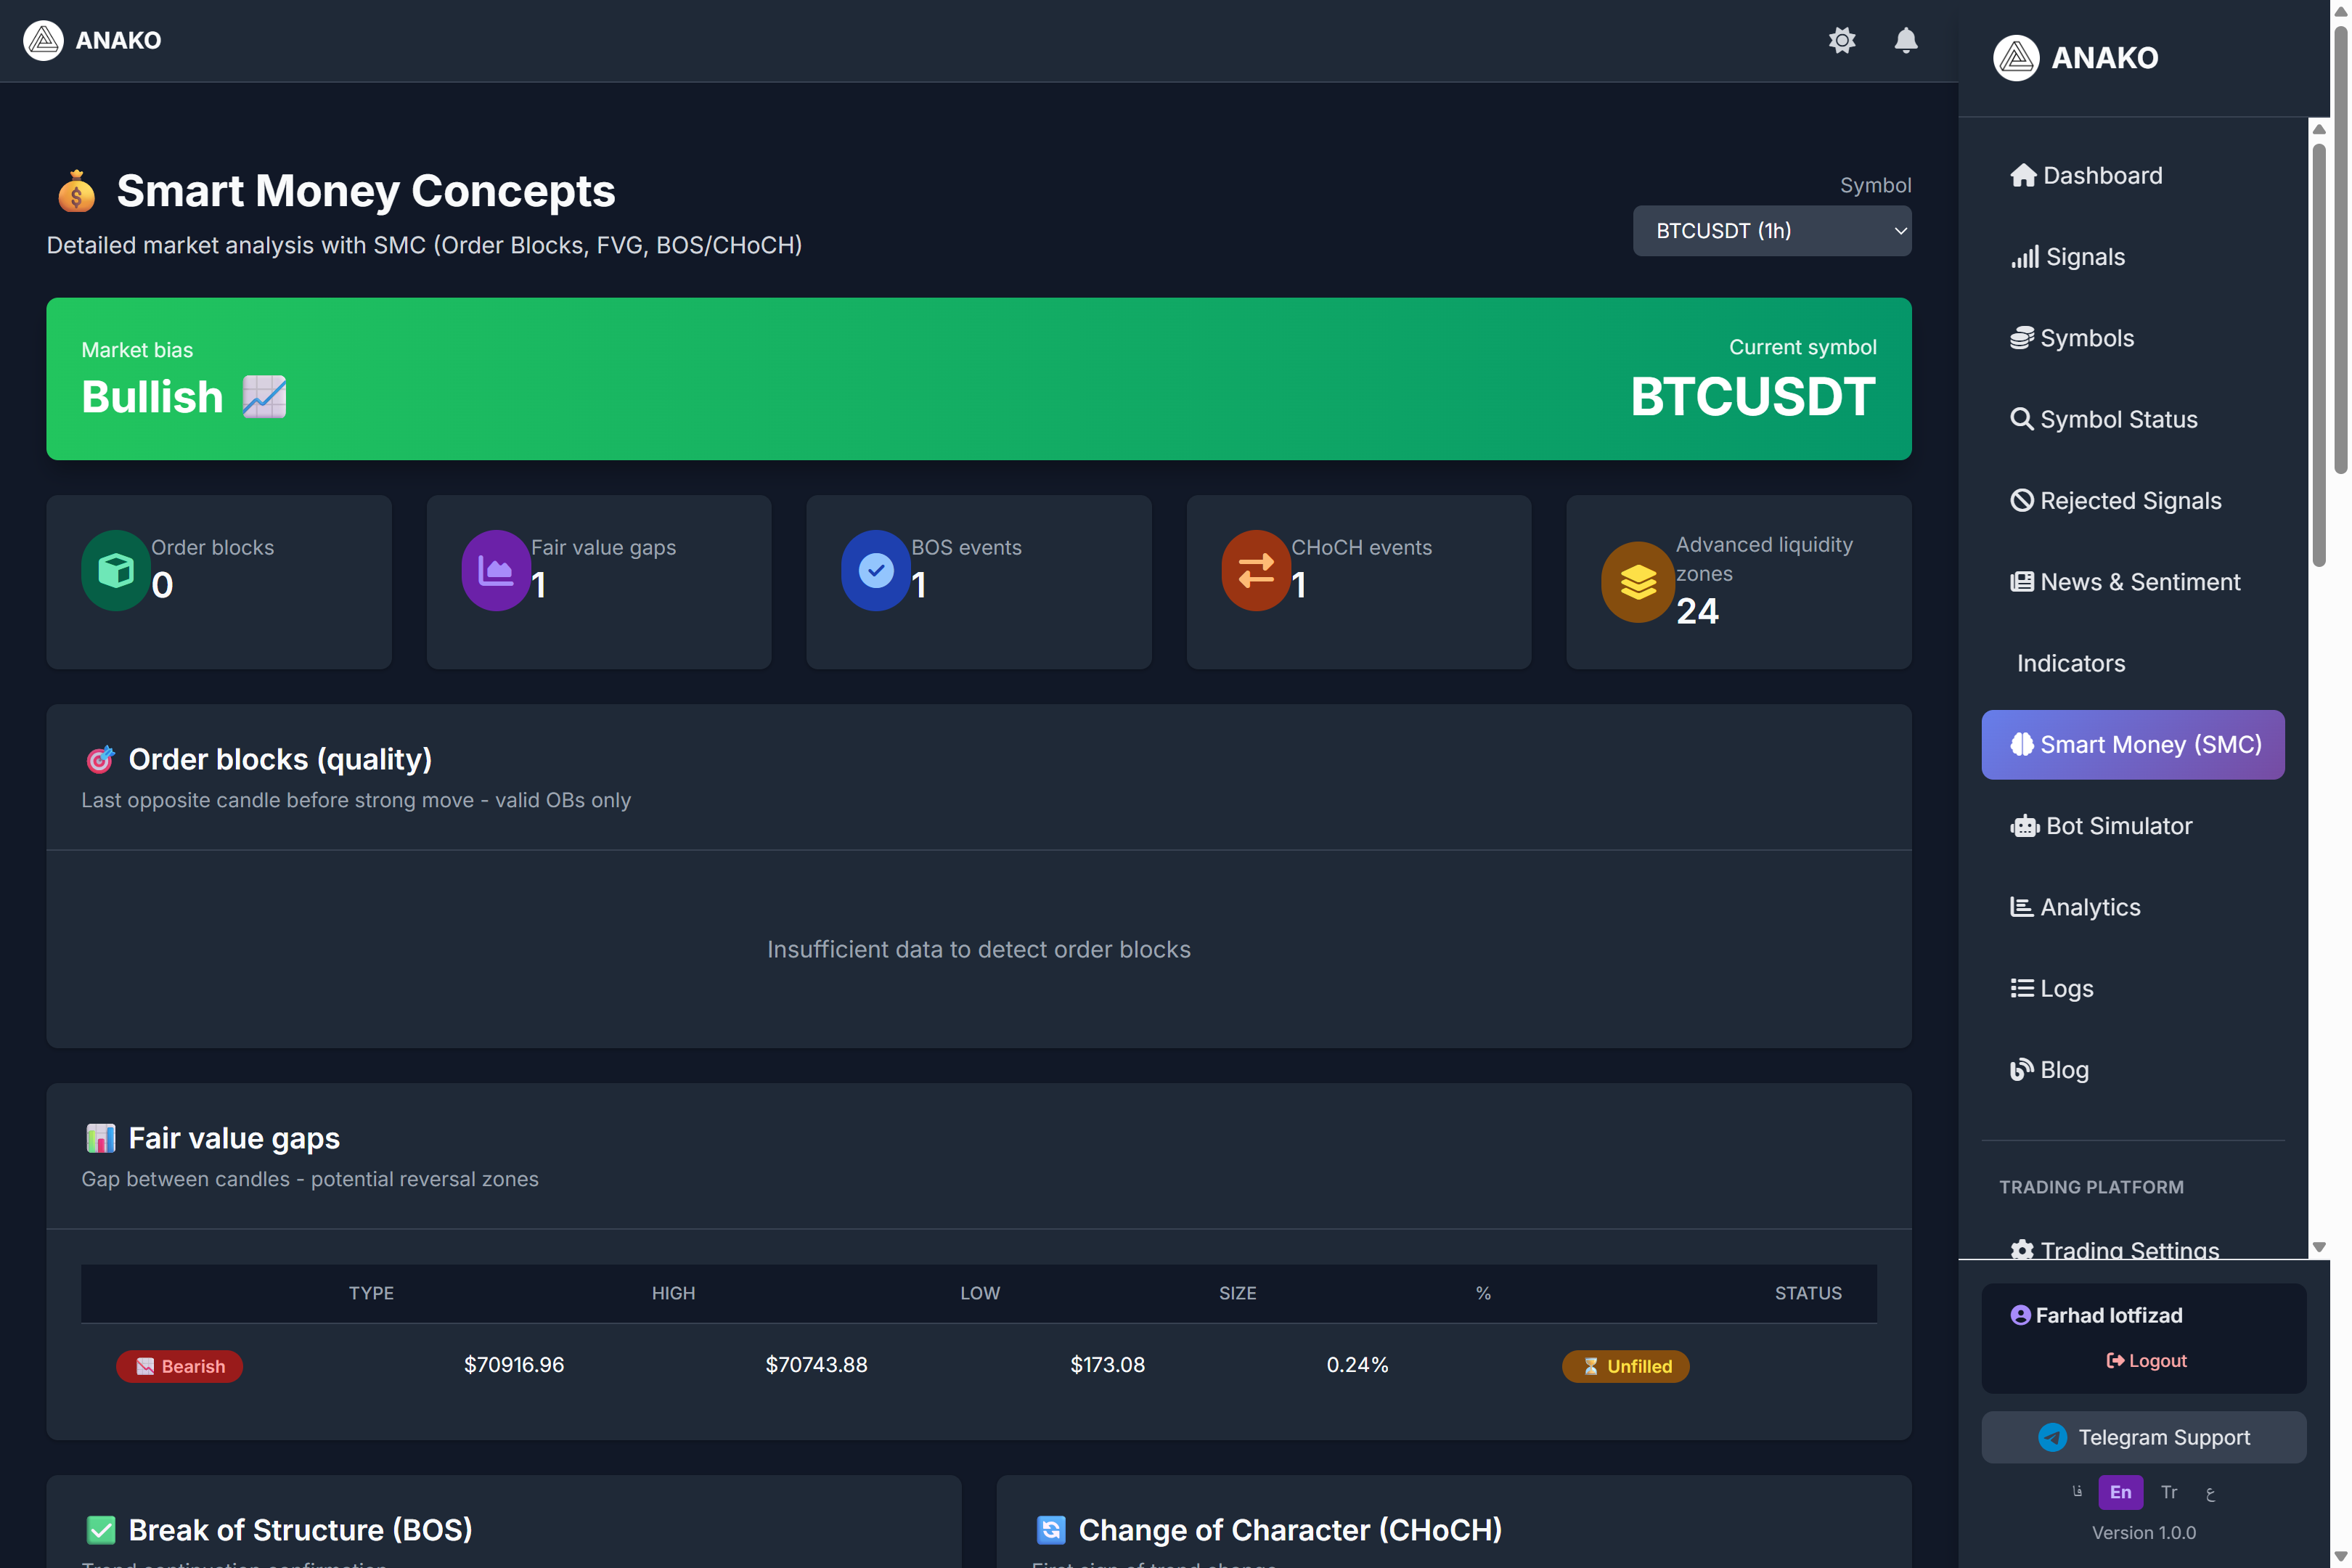
At the top of the page, the overall market status is displayed.
Example:
Market bias
Bullish
This means the system analysis shows the overall market tendency is currently bullish.
Market Bias is calculated by combining several factors:
Market structure
Liquidity
Price behavior
Smart Money signals
Main SMC Indicators
Several important indicators are displayed at the top of the page.
Order Blocks
Order Blocks are areas where large market orders have been placed.
These areas are usually entry points for financial institutions, and the price often reacts to them.
In the image:
Order blocks = 0
This means the system has not identified any new valid Order Blocks currently.
Fair Value Gaps (FVG)
FVG is a gap between candles that indicates the market moved at high speed, and the trading opportunity in that area was limited.
These areas are often filled by price in the future.
In the example image:
One FVG has been identified.
Its type:
Bearish
and it is still unfilled.
BOS – Break Of Structure
BOS occurs when the market structure is broken.
This is usually a sign of trend continuation.
In the image:
Bullish BOS
has been identified with high strength.
This means the market has confirmed its bullish structure.
CHoCH – Change Of Character
CHoCH is the first sign of trend change.
When the market changes from one trend to another, CHoCH is usually seen first.
In the image:
Bullish CHoCH
Displayed, which can be a sign of a change in market behavior.
Advanced Liquidity Zones
In financial markets, liquidity is the most important target of major players.
In this section, the system shows zones where the likelihood of liquidity presence is high.
Example:
Equal Highs
When several highs are at the same level, usually many stops accumulate above them.
These zones are often the target of price movement.
Liquidity Grab (Stop Hunt)
One of the common market behaviors is Stop Hunt.
In this case, the price temporarily crosses a level to collect traders' stops.
In the image, two Liquidity Grabs have been identified.
Example:
Sell-Side Grab
Strength 8/10
This indicates the probability of a reversal move after liquidity gathering.
Premium and Discount Zones
In the Smart Money style, the price is always analyzed in two zones:
Premium
Discount
Premium Zone
When the price is in this area, the market is considered relatively expensive.
This zone is usually more suitable for selling.
Discount Zone
In this zone, the price is considered relatively cheap.
It is usually more suitable for buying.
Equilibrium
This level indicates market balance.
In the example image:
Equilibrium
$69586
This zone is considered the middle of the price range.
Why is Smart Money important?
Traditional technical analysis methods often examine the behavior of retail traders.
But Smart Money seeks to analyze the behavior of major market players.
This method helps traders:
Find more precise entry points
Identify liquidity zones
Better understand major market moves
Advantages of ANAKO in Smart Money Analysis
The biggest problem with SMC analysis is that many of its concepts are analyzed manually.
The ANAKO AI platform automatically reviews these concepts and presents the results in the form of usable data.
This enables traders to analyze the market condition faster and more accurately.