One of the most important challenges in using trading signals is that users do not know how the real performance of a system is over time. For this reason, a section called Bot Simulator has been designed on the ANAKO AI platform.
This section simulates the system's signals in the form of a trading bot so users can see the real trading results.
What is Bot Simulator?
Bot Simulator is a trading simulation environment where:
Each signal generated by the system
is considered as a real trade.
In this environment, the system automatically checks the following:
Entry price
Stop loss
Profit targets
Trade duration
Trade result
This allows users to observe the system's performance under real market conditions.
Trading Bot Status
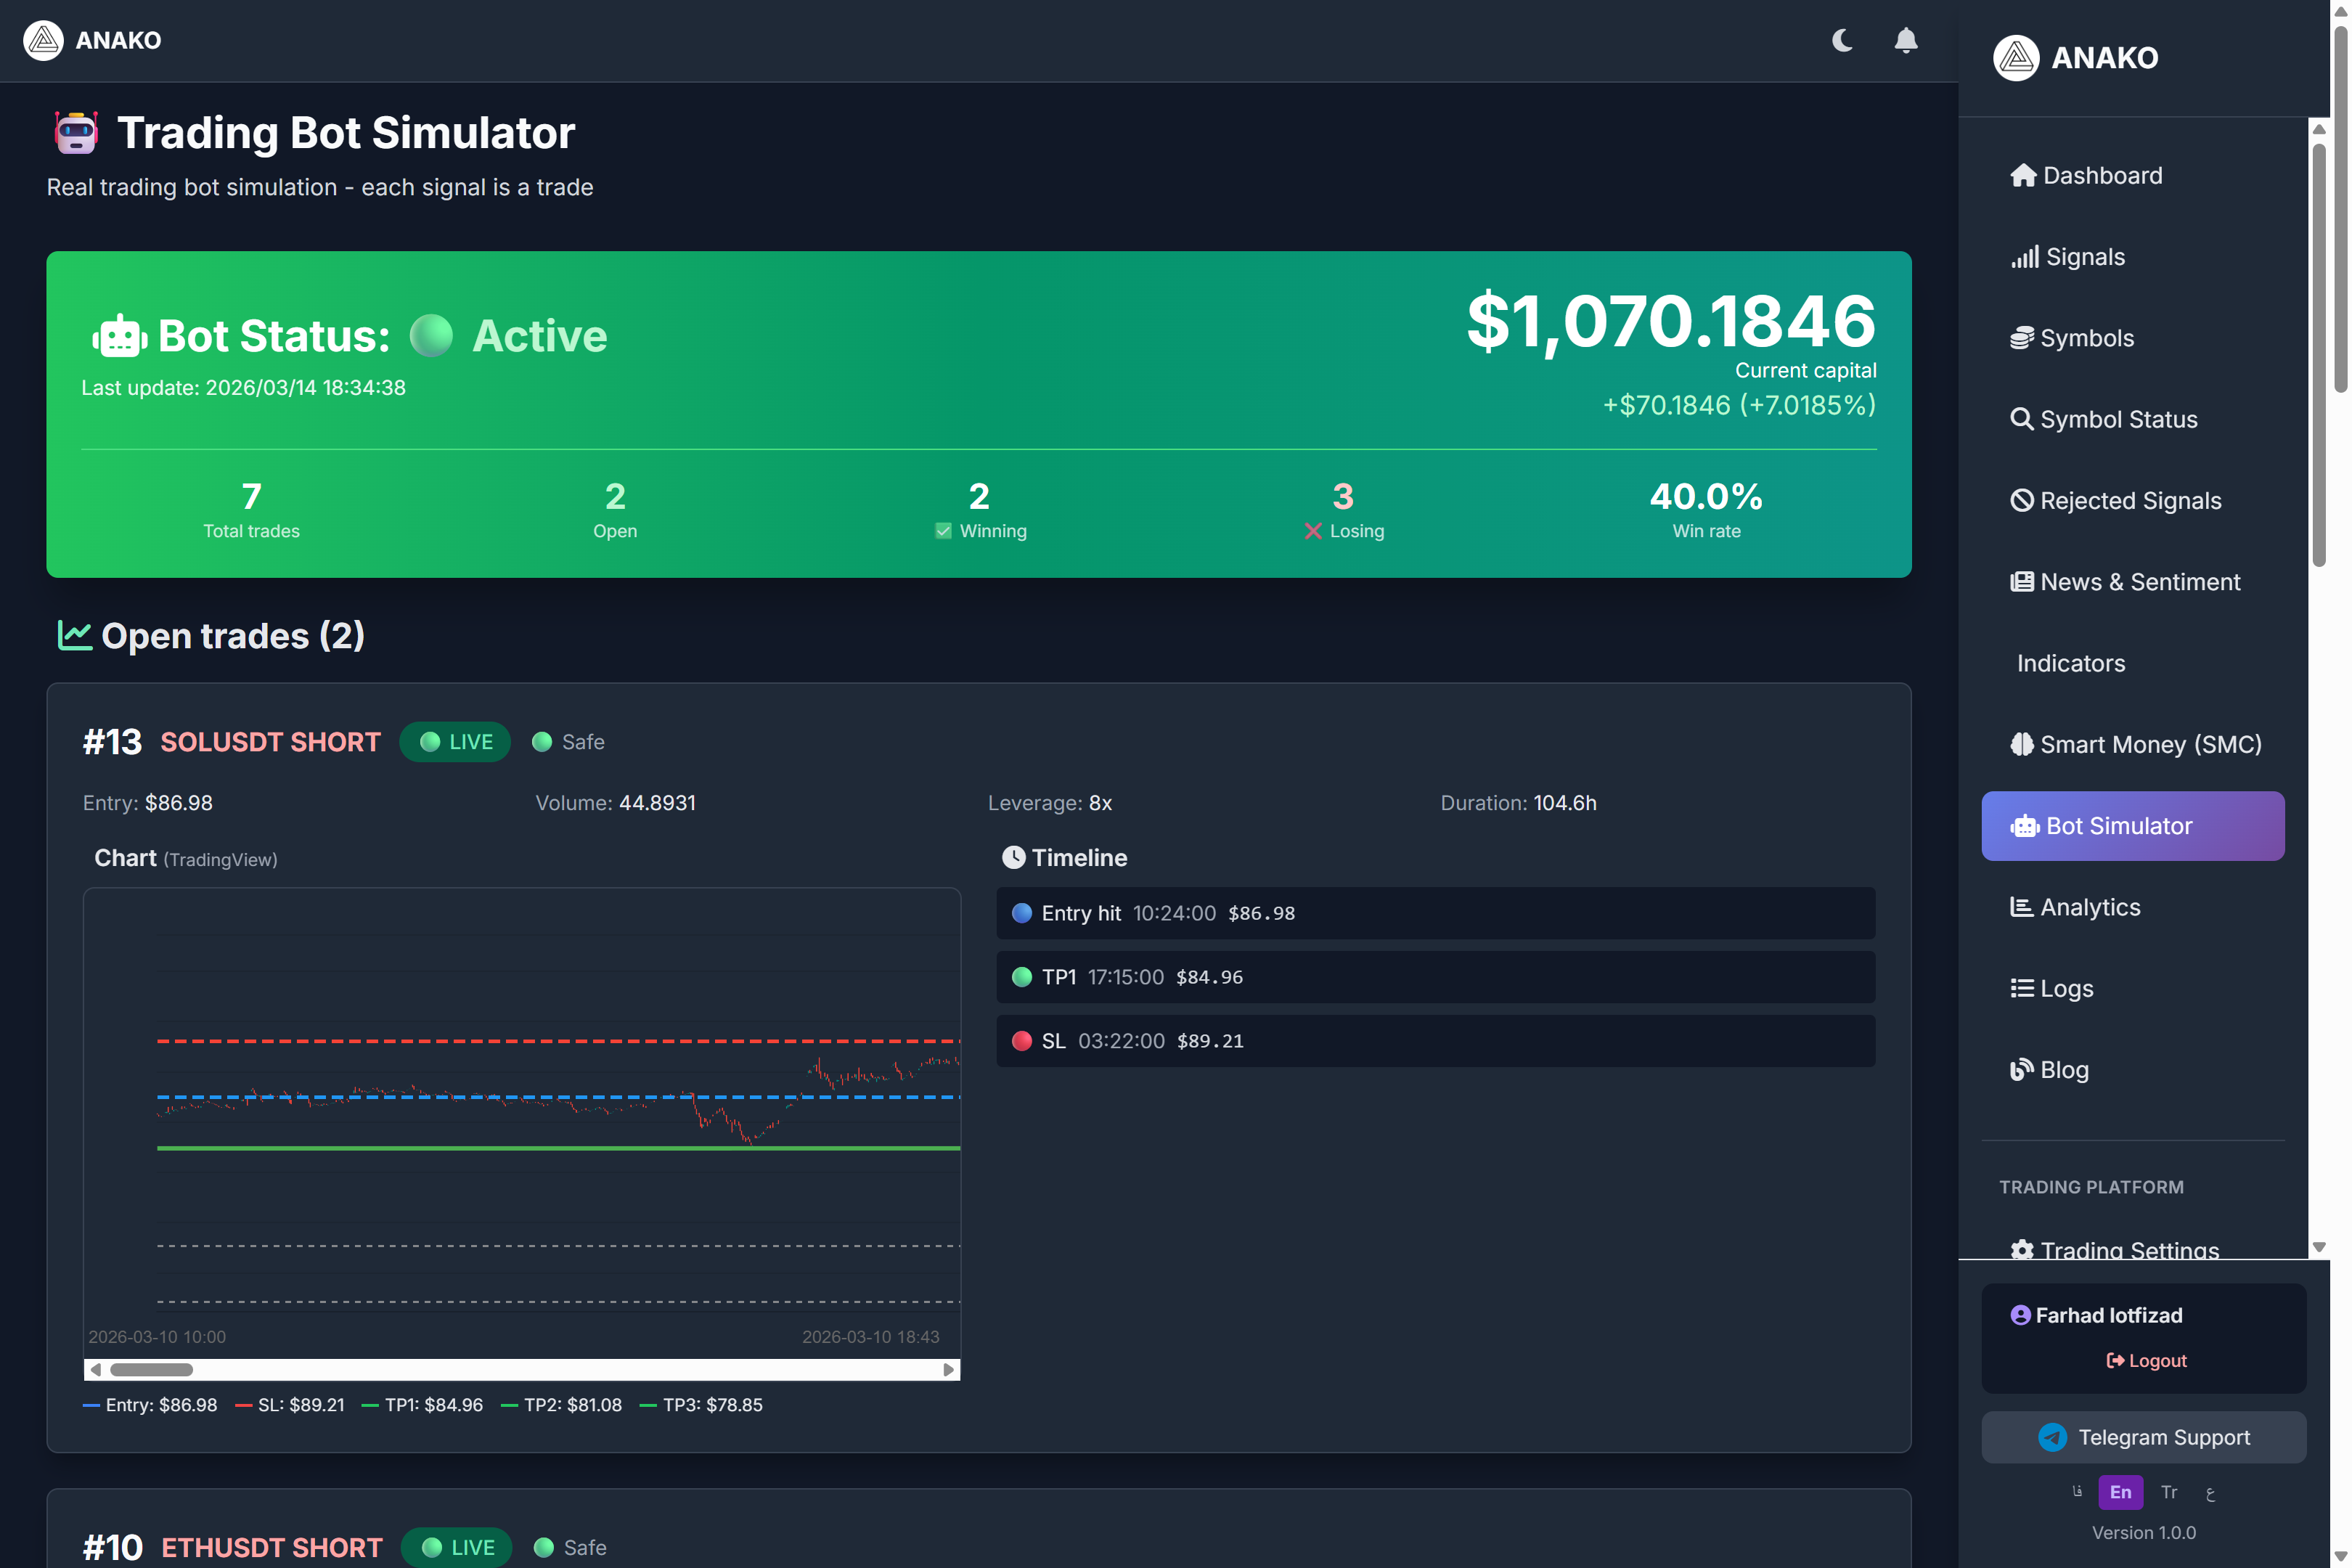
At the top of the page, the overall bot status is displayed.
Example:
Bot Status
Active
This means the bot is currently active and simulating trades.
Also, the time of the system’s last update is displayed.
Current Capital of the Bot
This section displays the current simulated capital.
Example:
Current capital
$1070.18
This number indicates that if the initial capital was, for example, 1000 dollars, the bot was able to generate a profit.
In the image:
+$70.18
+7%
Capital increase is recorded.
Overall Trading Statistics
This section displays overall information about the trades.
Total trades
The total number of trades executed by the bot.
Example:
7 trades
Open trades
Trades that have not yet been closed.
Example:
2 open trades
Winning trades
Number of profitable trades.
Example:
2 trades
Losing trades
Number of losing trades.
Example:
3 trades
Win Rate
Trade success percentage.
Example:
40%
The win rate indicates what percentage of trades were closed with a profit.
Open Trades
This section displays current trades that have not yet been closed.
Each trade includes important information such as:
Trading symbol
Trade type (Long or Short)
Entry price
Leverage
Trade volume
Trade duration
Example of a Trade
The image shows a trade for the symbol:
SOLUSDT
displayed.
Trade type:
SHORT
Entry price:
$86.98
Trade leverage:
8x
Trade Chart
For each trade, a chart is also displayed showing how the price has moved relative to the trade levels.
This chart includes:
Entry price
Stop Loss
Take Profit
.
This helps users to better understand the trade price movement trend.
Trade Timeline
Next to the chart, there is a section called Timeline showing the key events of the trade.
Example:
Entry hit
TP1
Stop loss
This information shows how the trade has progressed.
Why is Trade Simulation Important?
Many signal systems only provide entry points, but their actual performance is unknown.
The Bot Simulator helps users to:
Review the actual performance of the system
Observe trade risk management
See how signals are executed in the real market
Advantages of Bot Simulator in ANAKO
The ANAKO platform not only displays signals but also reviews their performance.
This enables users to:
Have greater transparency in system performance
Better understand the system’s strategy
Gain more trust in signals