Introduction
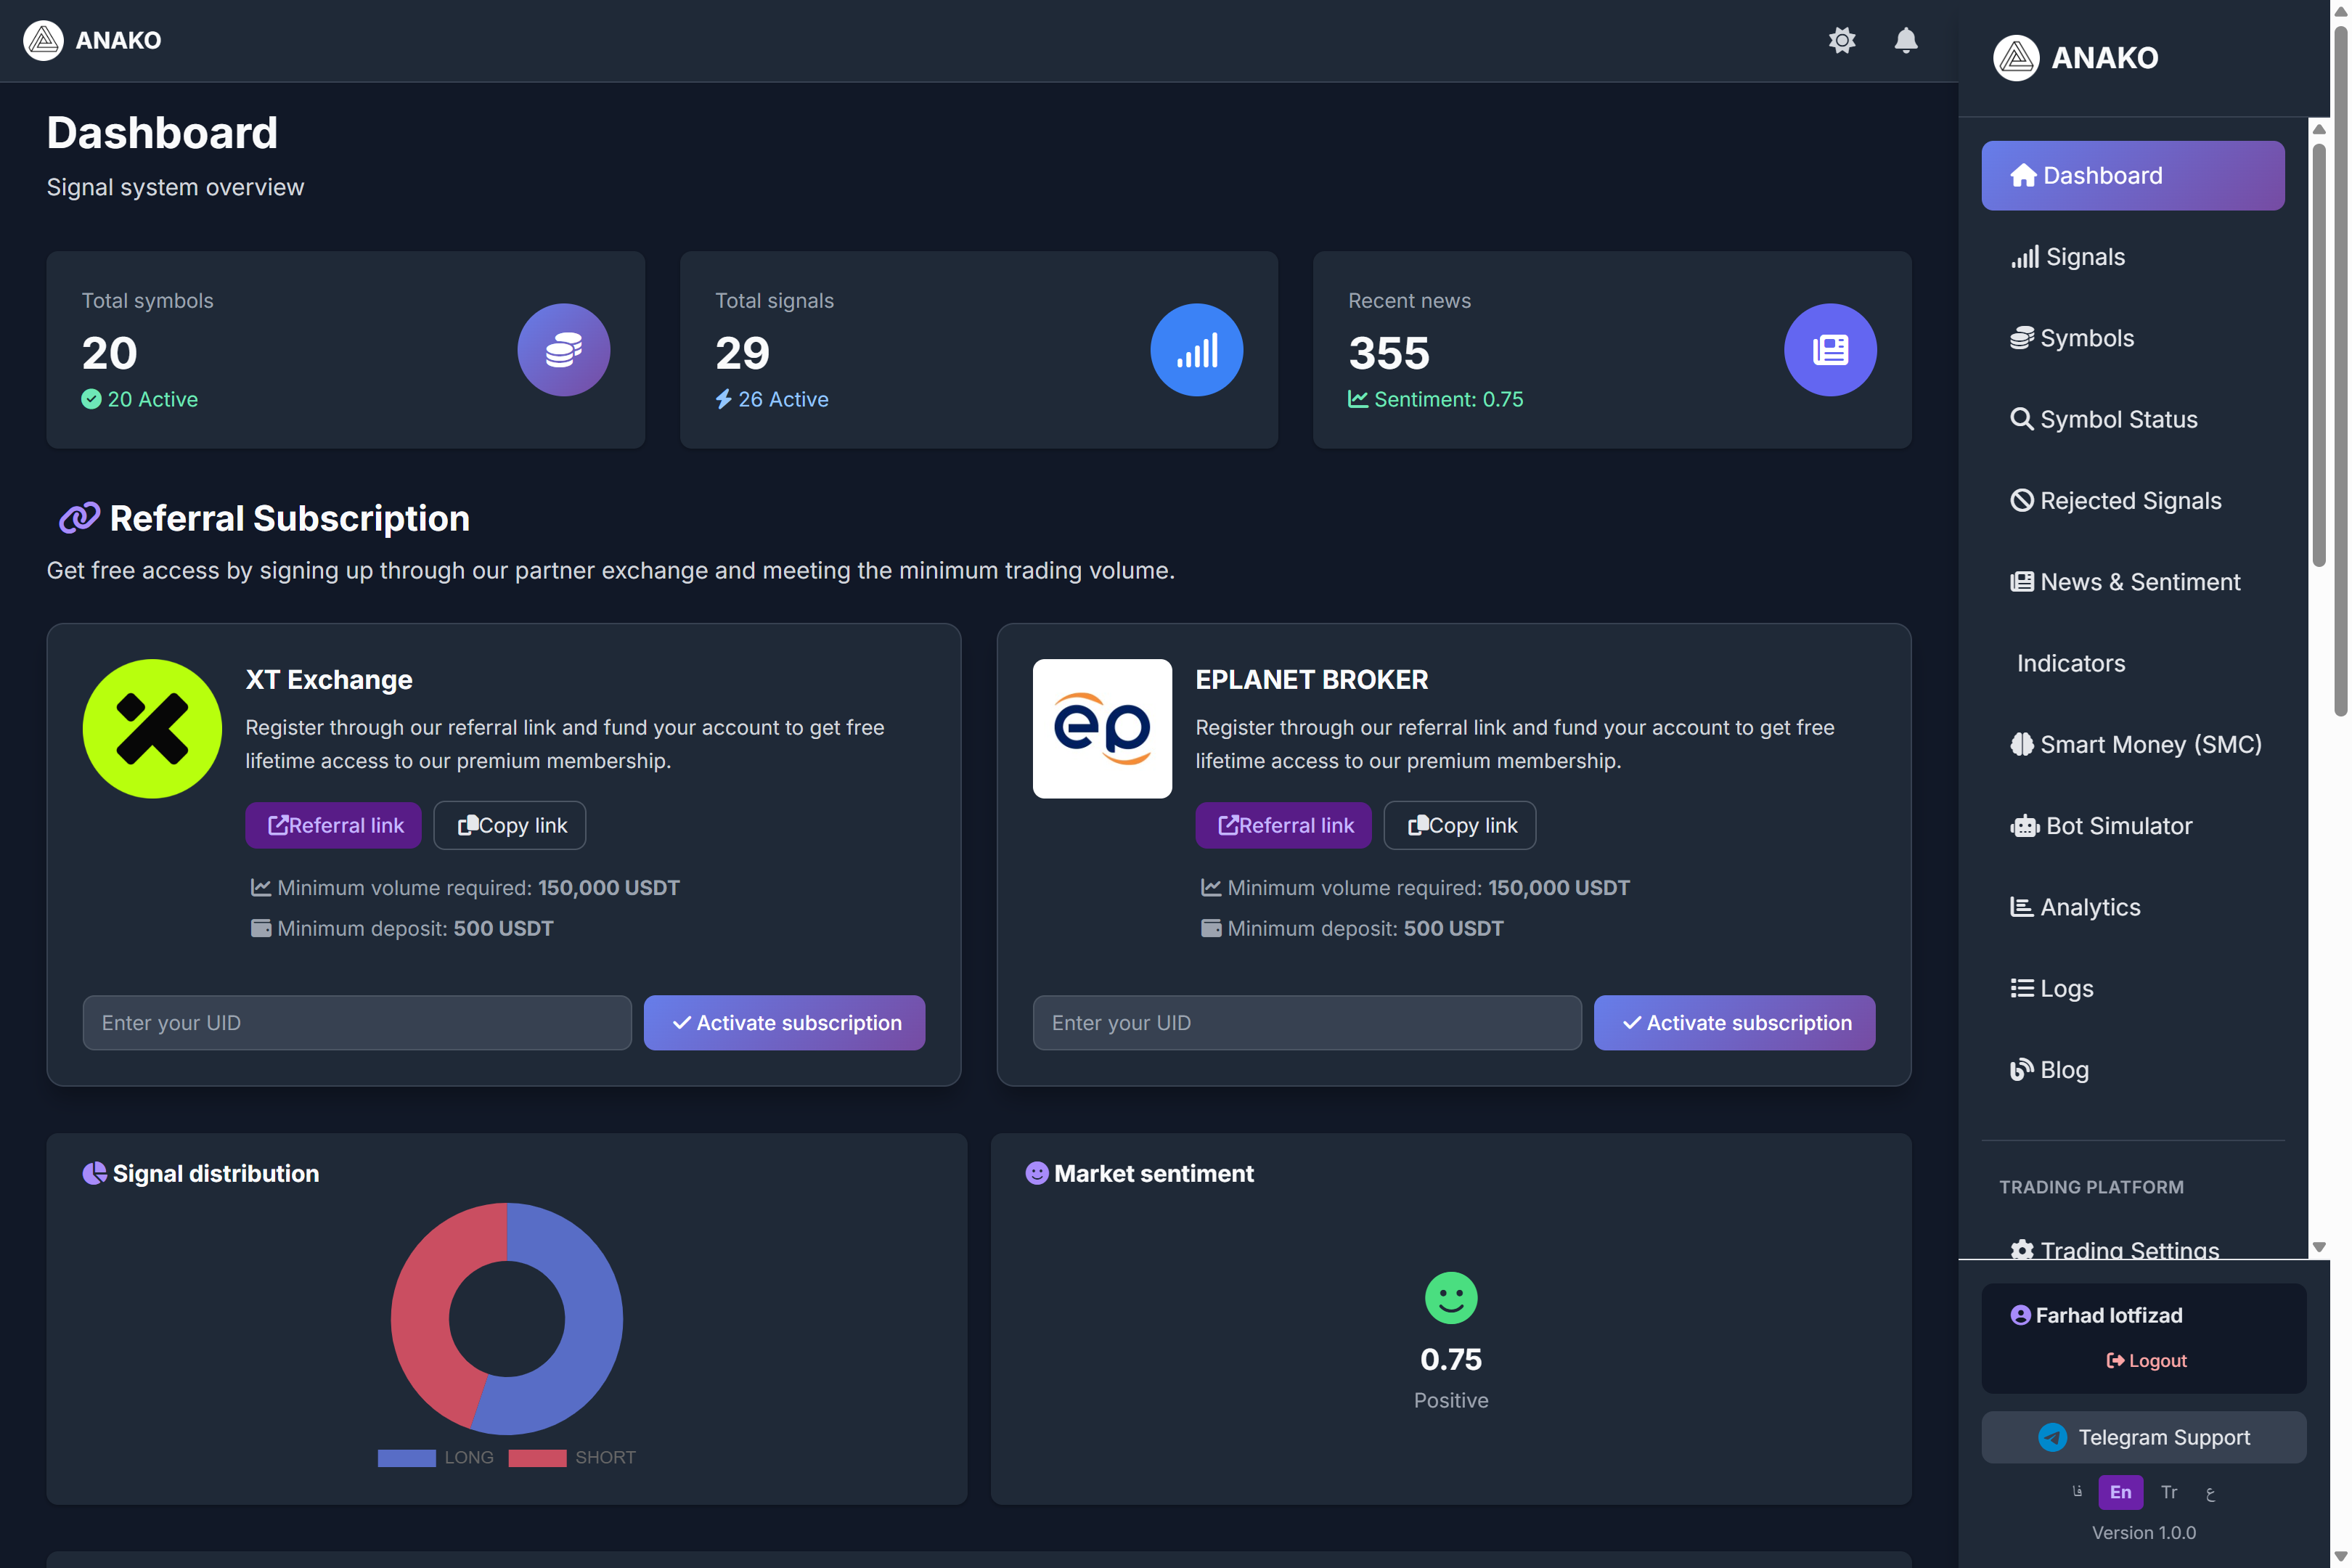
The ANAKO AI Signal artificial intelligence dashboard is the main center for managing trading signals, market conditions, and data analysis. On this page, users can view important market information, active signals, and market sentiment analysis all in one place.
This dashboard helps traders analyze market conditions quickly and simply without the need to review multiple different tools.
Section One: System Signal Overview
General system information is displayed at the top of the dashboard.
Total Symbols
This section shows the total number of symbols monitored by the ANAKO system.
For example, in the image:
20 Symbol Active
This means the AI system is analyzing 20 different markets.
Total Signals
This section displays the number of signals generated by the system.
For example:
29 Signals
26 Active
Meaning there are 26 active signals in the system.
Recent News
This part shows the number of news items analyzed by the system.
The ANAKO AI reviews financial news and analyzes their impact on the market.
In the image:
Sentiment: 0.75
This means the market sentiment is evaluated as positive.
Section Two: Free Subscription via Referral
In this section, users can get a free subscription by signing up with partner exchanges.
XT Exchange
By registering at XT Exchange through a referral link, users can gain access to a premium subscription.
Activation conditions:
Minimum trading volume
150,000 USDT
Minimum deposit
500 USDT
After registration, the user must enter their account UID and select the Activate Subscription option.
Eplanet Broker
This broker is also one of the ANAKO system partners where users can sign up via referral link.
After activating the account and completing the required trades, the system subscription is activated.
Section Three: Signal Distribution
In the Signal Distribution section, the signal distribution chart is displayed.
This chart shows how much of the signals are:
LONG (Buy)
SHORT (Sell)
.
This information helps users get an overall view of the market direction.
Section Four: Market Sentiment Analysis
The Market Sentiment section shows the overall market sentiment status.
This analysis is based on various data including:
Financial news
Trading volume
Market behavior
Social network data
In the image, we see:
Sentiment = 0.75
Positive
Meaning the overall market sentiment is assessed as positive.
Section Five: Recent Trading Signals
In the Recent Signals part, the latest signals generated by artificial intelligence are displayed.
This table contains important information:
Symbol
Trading symbol
For example:
BTCUSDT
XRPUSDT
SOLUSDT
Direction
Trade direction
LONG
SHORT
Smart Score
The smart signal score calculated by the Anako algorithm.
The higher this number, the better the signal quality is evaluated.
Entry Price
Suggested entry price for the trade.
Confidence
Algorithm confidence percentage regarding the signal.
Whale Indicator
This section indicates whether whale activity in the market has impacted this signal or not.
Timeframe
Signal analysis timeframe.
For example:
1h
Time
Signal production time.
Platform Main Menu
On the right side of the dashboard is the system's main menu where users can access various sections.
Including:
Signals
Symbols
News & Sentiment
Indicators
Smart Money
Bot Simulator
Analytics
Each of these sections provides advanced analytical tools for traders.
Summary
The ANAKO AI Signal platform dashboard is a comprehensive control center for financial market analysis.
On this page, users can:
View trading signals
Analyze market sentiments
Review market information
And improve their trading strategy.
Using this dashboard helps traders make faster and more precise decisions in crypto and forex markets.