One of the important sections in the ANAKO AI Signal platform is the Currencies section. In this section, users can view the complete list of currencies and trading symbols that are analyzed by the artificial intelligence system.
This section helps users quickly understand which markets are currently active and which symbols have generated signals.
What is the Currencies Page?
On the Currencies page, a list of all currency pairs analyzed by the system is displayed.
For example:
-
BTCUSDT
-
ETHUSDT
-
BNBUSDT
-
AVAXUSDT
-
ADAUSDT
-
DOGEUSDT
-
APTUSDT
Each symbol is displayed as a separate card showing its important information.
Information Displayed for Each Symbol
The following information is displayed on each card:
Symbol Status
If the analysis for that symbol is active, its status is shown as Active.
This means the system is currently monitoring the market and generating signals for that currency.
Analysis Timeframe
In this example, most analyses are in the timeframe:
1H (one hour)
are performed.
Analysis in this timeframe is suitable for short-term and medium-term trading.
Number of Signals
This section shows how many signals have been generated for that symbol.
Example:
BNBUSDT
Signals: 4
BTCUSDT
Signals: 3
Number of Analyzed Candles
This section displays the number of candle data points used for the analysis.
Example:
Candles: 698
The more historical data used in the analysis, the more accurate decisions the artificial intelligence model can make.
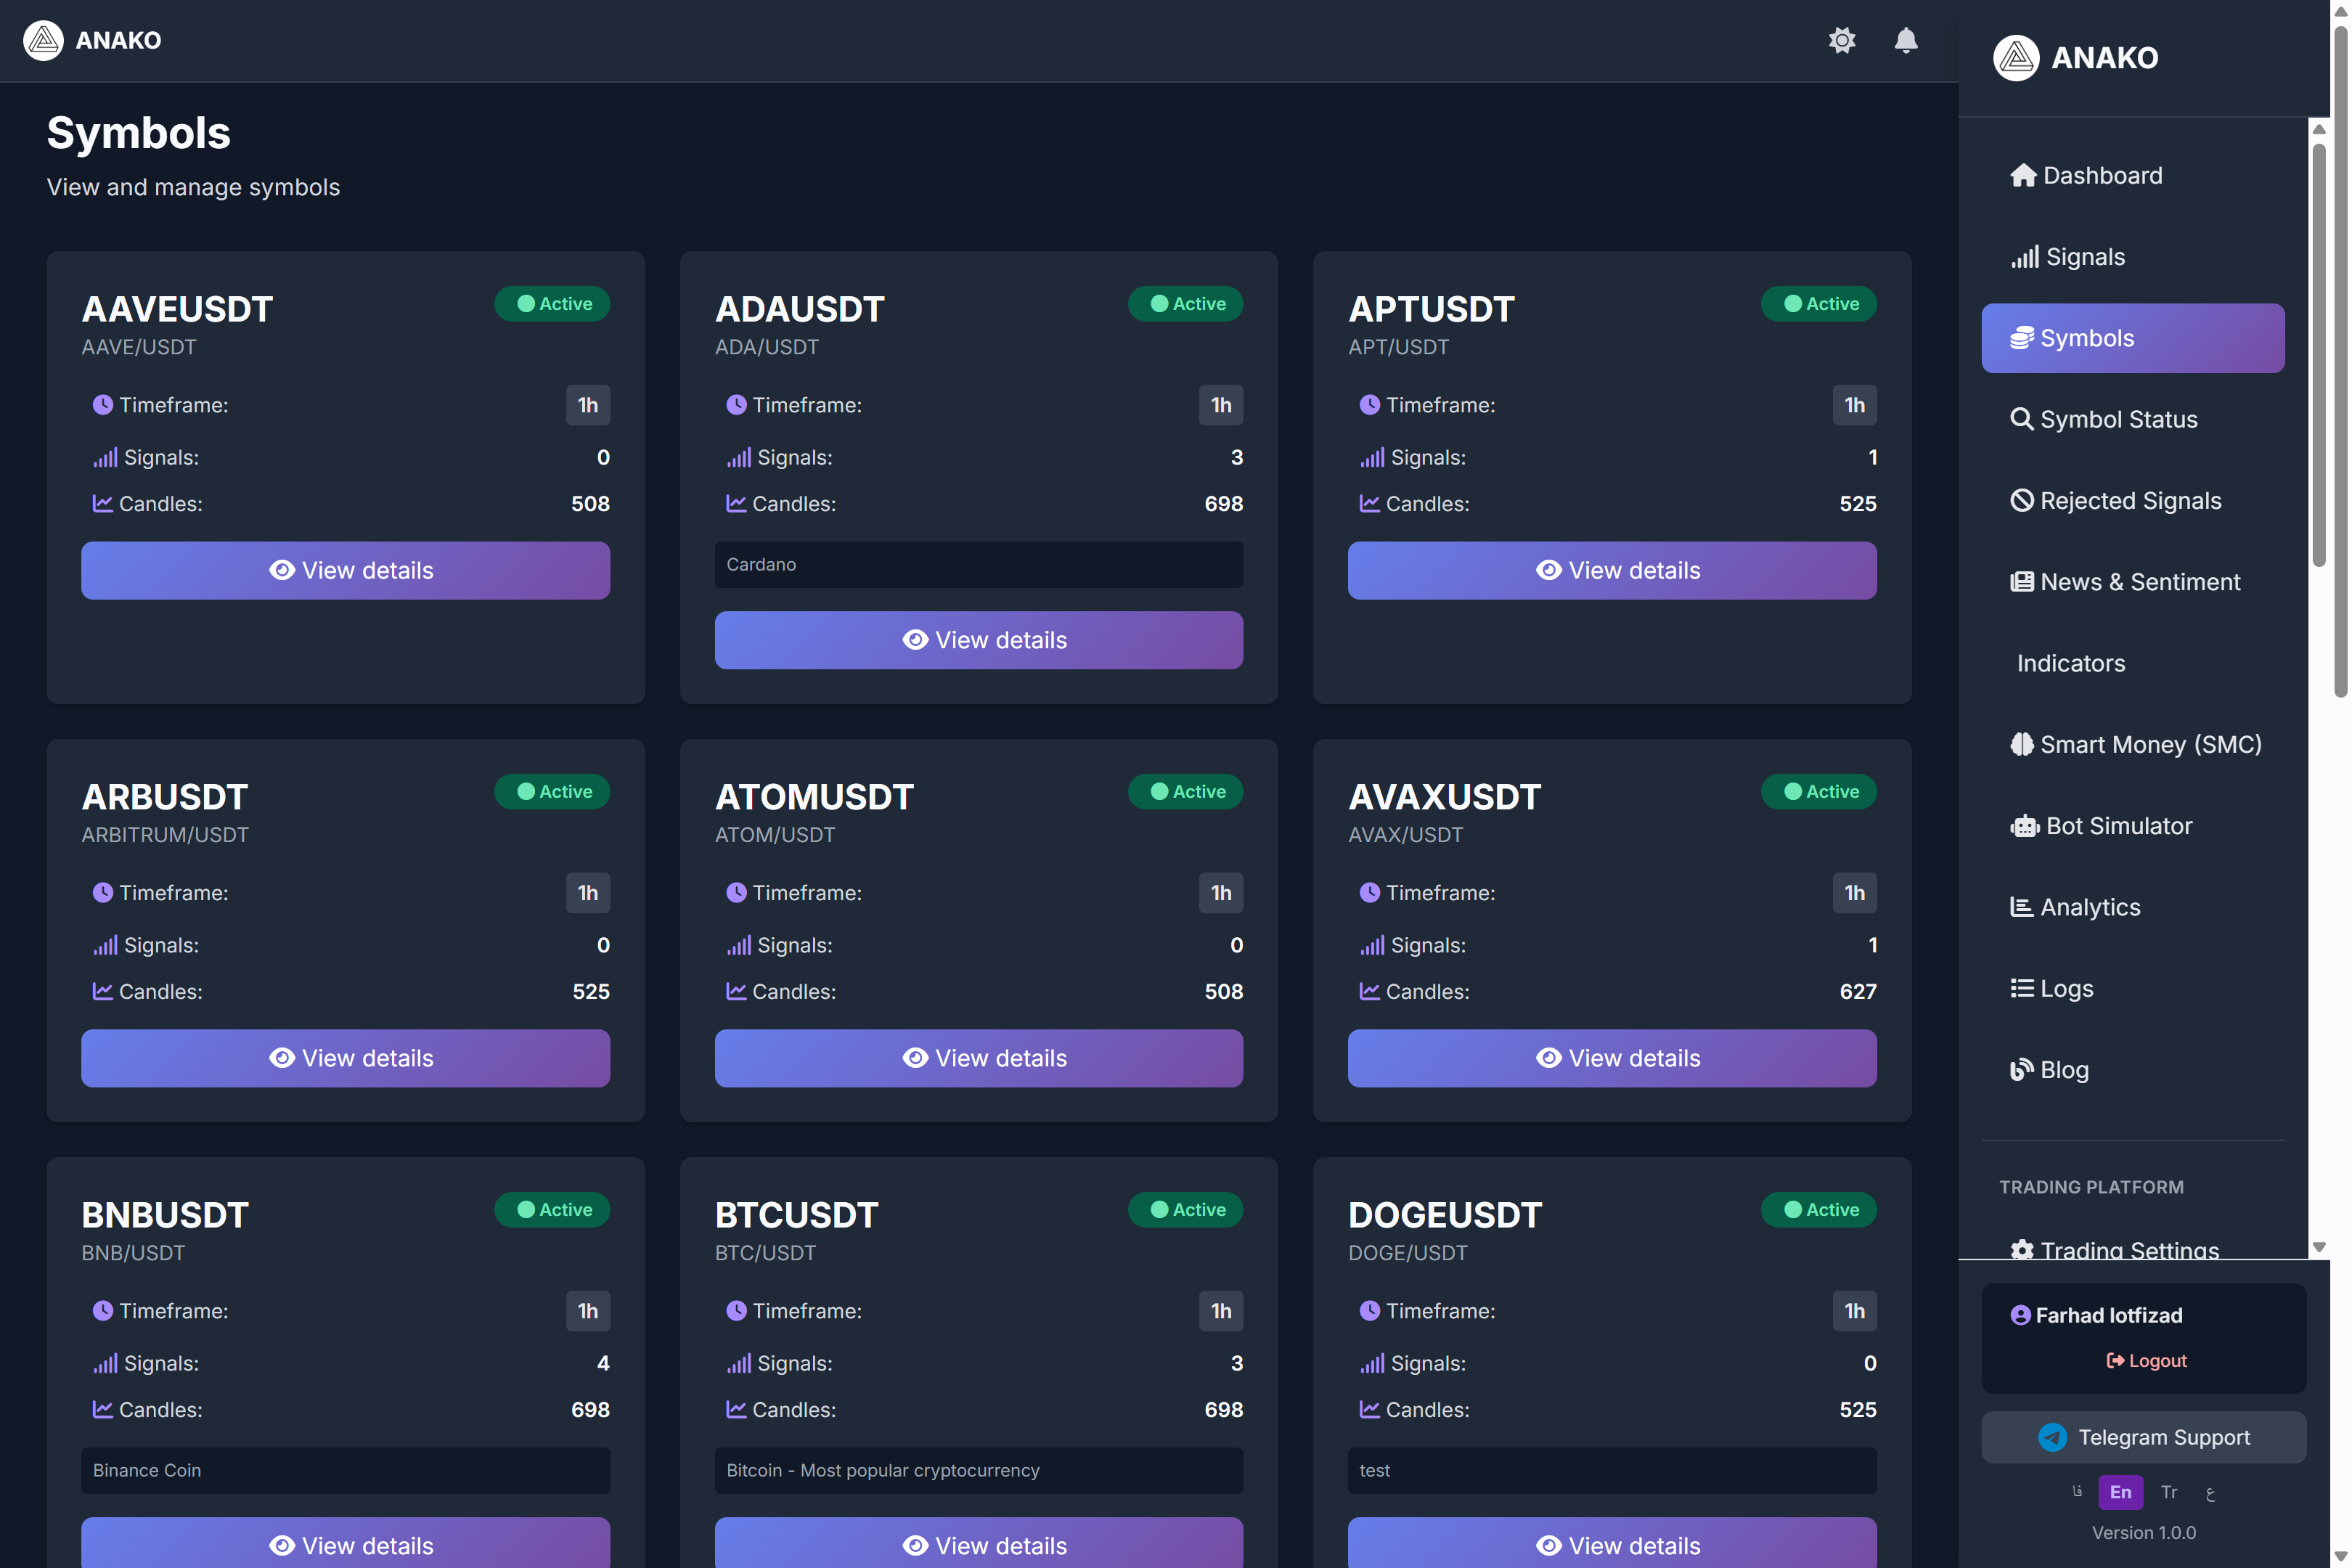
What is the Symbols Page?
On the Symbols page, a list of all currency pairs analyzed by the system is displayed.
For example:
-
BTCUSDT
-
ETHUSDT
-
BNBUSDT
-
AVAXUSDT
-
ADAUSDT
-
DOGEUSDT
-
APTUSDT
Each symbol is displayed as a separate card showing its important information.
Information Displayed for Each Symbol
The following information is displayed on each card:
Symbol Status
If analysis for that symbol is active, its status is shown as Active.
This means the system is monitoring the market and generating signals for that currency.
Analysis Timeframe
In this example, most analyses are performed on the timeframe:
1H (one hour)
timeframe.
Analysis in this timeframe is suitable for short- and medium-term trades.
Number of Signals
This section shows how many signals have been generated for that symbol.
Example:
BNBUSDT
Signals: 4
BTCUSDT
Signals: 3
Number of Candles Analyzed
This section displays the number of candle data used for the analysis.
Example:
Candles: 698
The more historical data used in the analysis, the more accurate the AI model can make its decisions.
Recent Signals
At the bottom of the page, there is a section titled Recent Signals.
This section displays the latest signals generated for that symbol.
The information shown in this table includes the following:
Direction
Entry Price
Stop Loss
Take Profits
Confidence
Time
This information helps users review the performance of previous signals.
Why is this section important?
The Symbols section is one of the most important parts of the platform because:
-
Users can quickly find active markets
-
The overall status of signals is clarified
-
The performance of past signals can be reviewed
-
Technical analysis of each symbol is available
Conclusion
The Symbols section in the ANAKO platform is a powerful tool for quickly reviewing the market. Users can use this section to view active symbols, check signals, and analyze market conditions.
This feature helps traders make their trading decisions more informed and accurate.