After generating each signal on the ANAKO AI Signal platform, users can enter the Signal Details page to view all analytical information, risk management, and trading parameters of that signal.
This page is one of the most important parts of the system because, in addition to displaying the entry point, stop loss, and targets, it also provides a complete market analysis, capital management, time analysis, and even compound profit calculations.
Next, we will review the different sections of this page.
Main Signal Information
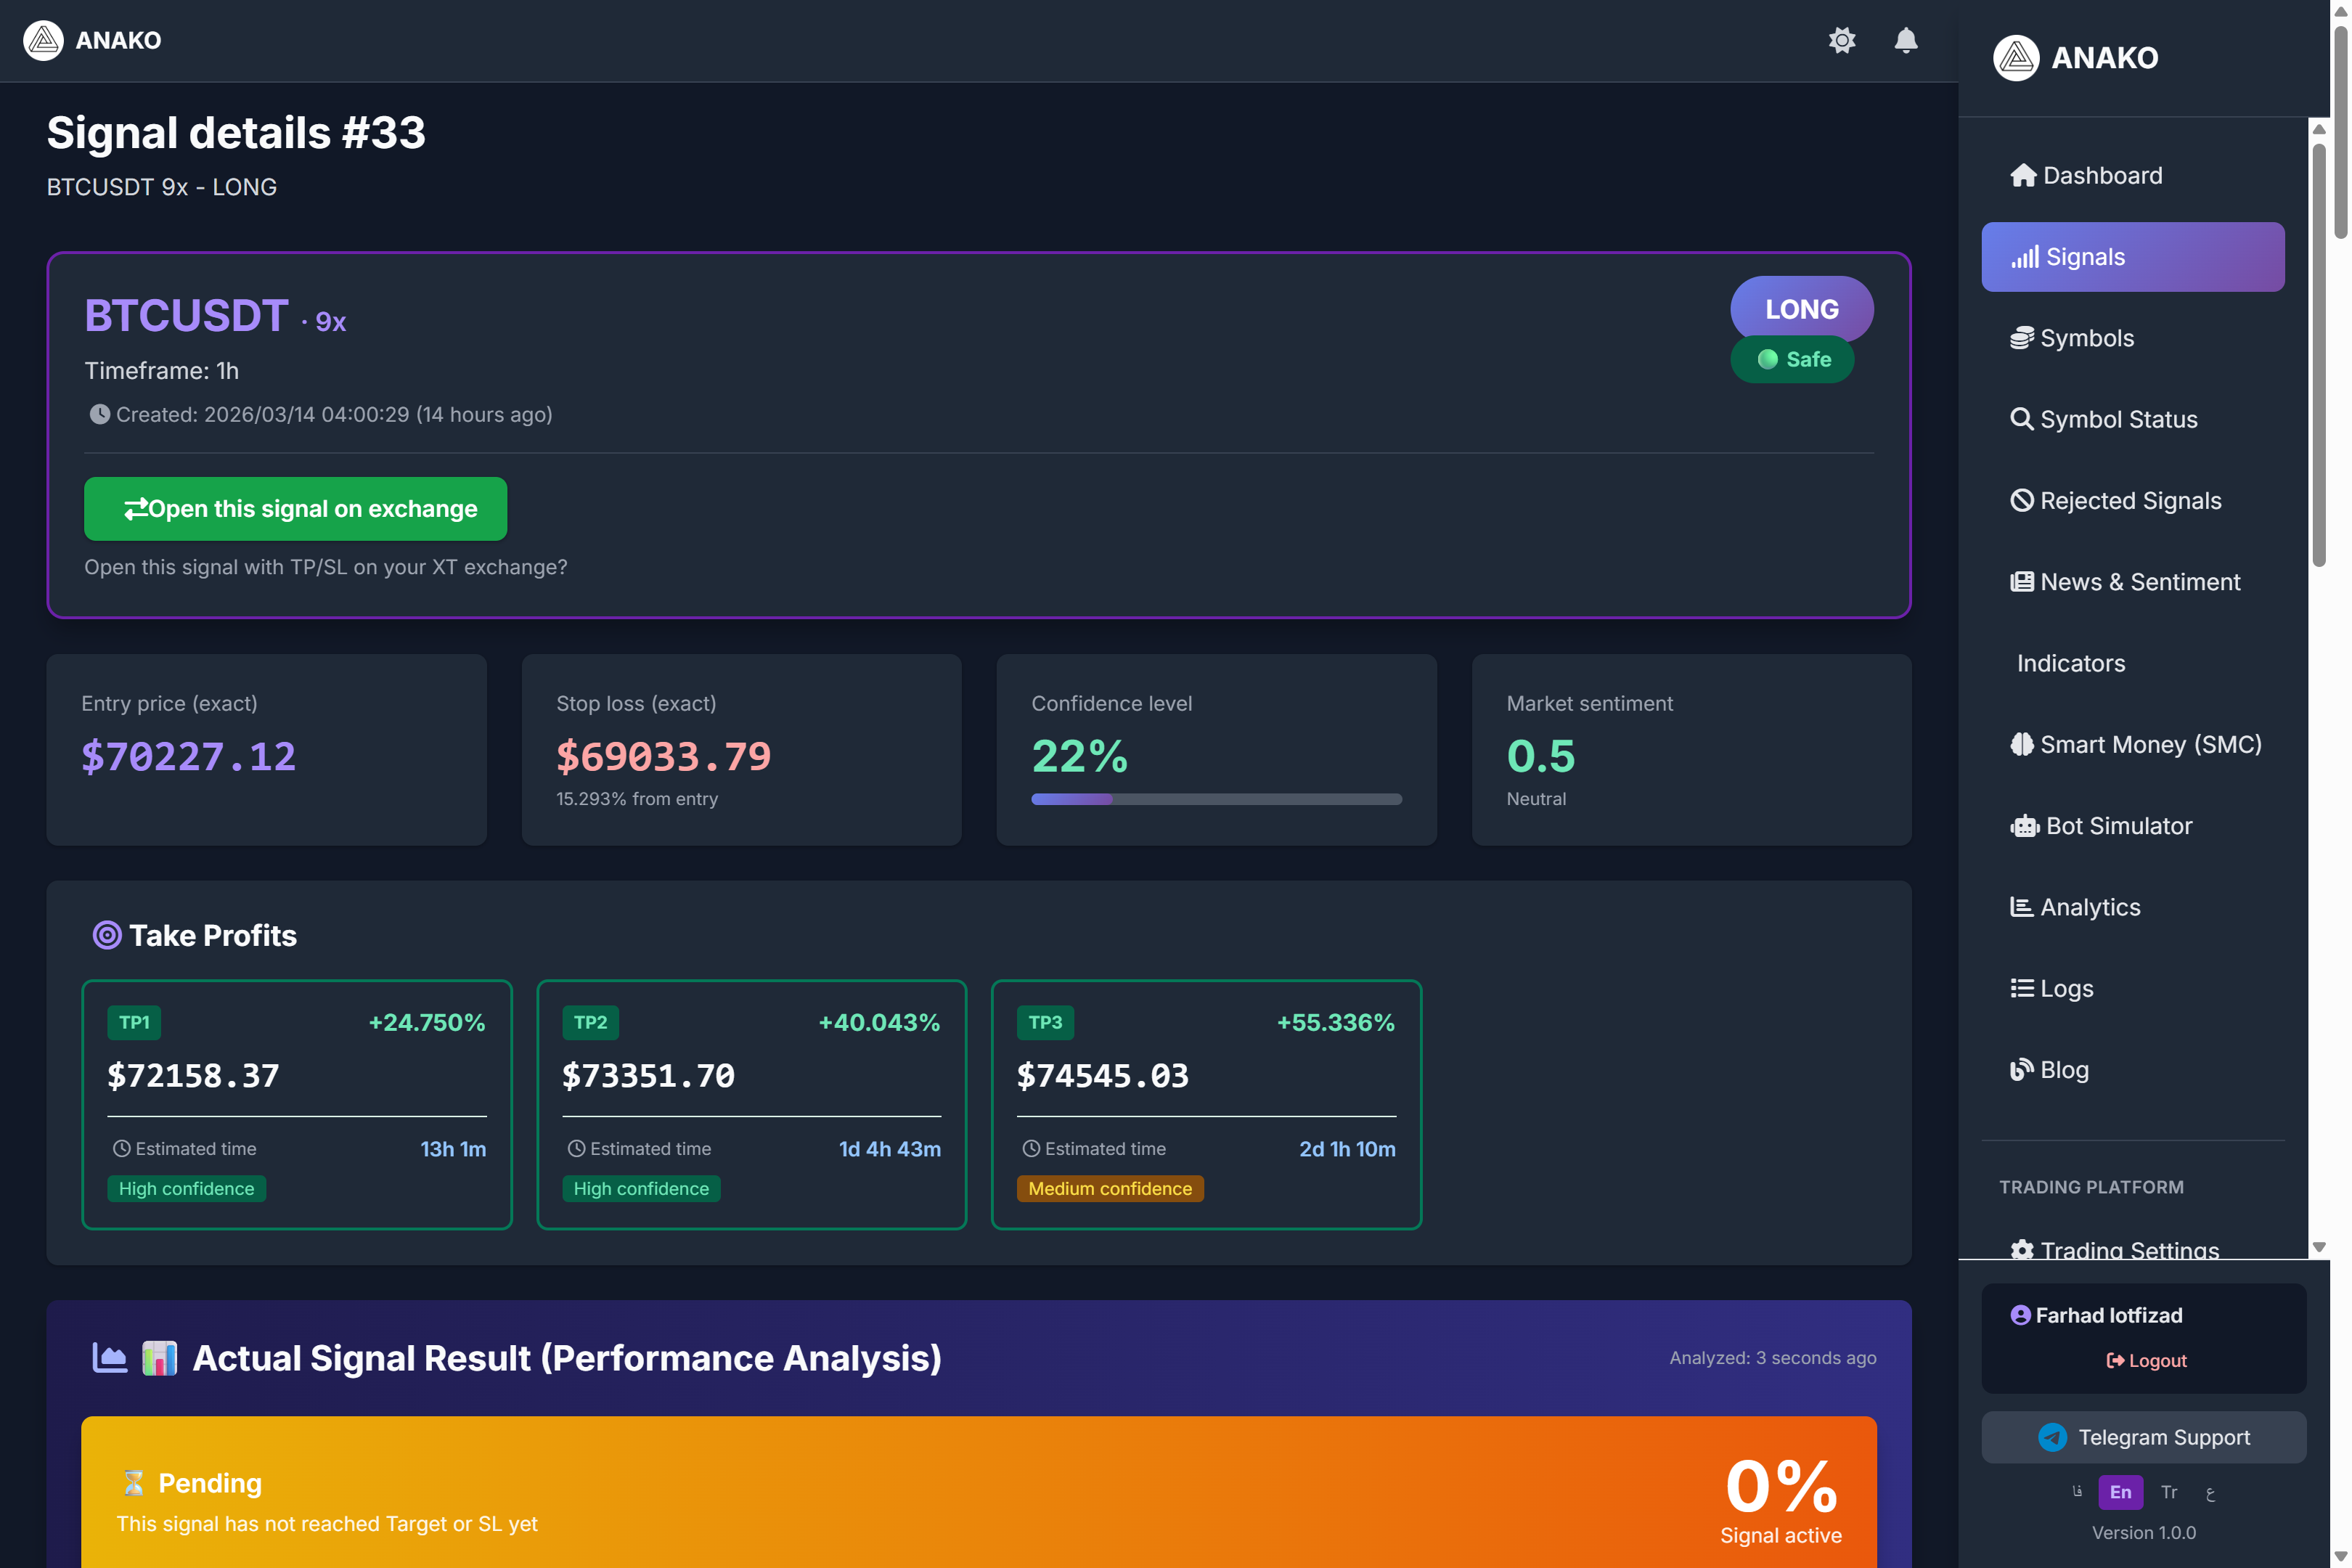
At the beginning of the page, the basic signal information is displayed.
This information includes the following:
Trading Symbol
Such as:
BTCUSDT
ETHUSDT
BNBUSDT
Type of Trade
LONG (Buy)
SHORT (Sell)
Recommended Leverage
For example:
9x
Analysis Time Frame
Such as:
1H
4H
15M
Entry Price
In this section, the exact price to enter the trade is specified.
Example:
Entry Price
$70,227
This is the price the system suggests to open the trade.
Stop Loss
Stop Loss is the price at which, if the market moves contrary to the analysis, the trade will be closed to prevent further loss.
Example:
Stop Loss
$69,033
This means if the price reaches this level, the trade will be closed.
Take Profit Targets
The ANAKO system usually provides several profit targets for each trade.
Example:
TP1
TP2
TP3
Sample:
TP1
$72,158
TP2
$73,351
TP3
$74,545
The higher the target, the greater the profit, but the longer it will take to reach.
Confidence Level (Signal Confidence Percentage)
One of the important features of the ANAKO system is displaying the Confidence Level.
For example:
22%
This number indicates the level of confidence the system has in generating this signal.
This value is calculated based on several factors:
-
Trend strength
-
Trading volume
-
Market structure
-
Indicators
-
Multi-timeframe analysis
Performance Analysis
This section reviews the signal’s performance in real-time.
Information such as:
Entry activated
Max favorable move
Max adverse move
Stop loss status
Example:
Max favorable move
+9.15%
This means the market has moved about 9% in favor of the trade up to this moment.
Professional Candlestick Chart
In this section, a professional chart styled like TradingView is displayed.
The following lines are identified on this chart:
Entry
Stop Loss
Take Profit
Users can observe price behavior relative to these levels.
Intelligent Scorecard
One of the most important parts of the system is the Intelligent Scorecard.
In this section, the system scores each signal from 0 to 100.
For example:
Total Score
58.3 / 100
This score is calculated based on several factors:
Trend
Momentum
Volume
Support / Resistance
Patterns
Sentiment
Fundamental
This system helps the quality of signals to be evaluated faster.
Fundamental Analysis
In this section, the fundamental conditions of the market are examined.
Items such as:
Liquidity
Whale activity
Market strength
Momentum
Example:
Liquidity
45 / 100
Market strength
60 / 100
Summary of Technical Analysis
In this section, the system shows the status of indicators.
Including:
EMA 50
EMA 200
RSI
MACD
ATR
Example:
EMA50 = 70965
EMA200 = 69925
Status: Bullish pullback
Smart Money Concepts (SMC)
The ANAKO platform also uses Smart Money concepts.
The following items are displayed in this section:
Market Bias
Break of Structure (BOS)
Change of Character (CHOCH)
Liquidity zones
Order blocks
Example:
Bullish BOS
Bullish CHOCH
These indicate the behavior of the market's large capital.
Multi-Timeframe Analysis
The system examines market conditions across multiple timeframes.
Example:
Daily
Bullish
4H
Bullish
1H
Bullish
This helps ensure trading is done in the direction of the main market trend.
Position Management
This section shows how to manage a trade.
There are two main parts:
Scaling In
Scaling Out
Scaling Out means the gradual exit from the trade.
Example:
TP1
TP2
TP3
Smart Leverage Selection (Smart Leverage)
The ANAKO system automatically suggests the best leverage.
Example:
Selected leverage
9x
This amount is calculated based on the following:
Confidence
Risk
Market volatility
Signal score
Why was this leverage amount selected?
One of the interesting features of the ANAKO system is the detailed explanation of the reason for selecting Leverage.
The system intelligently calculates the appropriate leverage based on several important parameters.
Selected Leverage
In the example above:
Leverage = 9x
This amount was not randomly chosen.
The system calculates it based on these factors:
1️⃣ Signal Confidence
Confidence: 22%
The lower the signal confidence, the more conservative leverage the system suggests.
2️⃣ Stop Loss Distance
Stop Loss Distance:
1.699%
If the stop loss distance is average, the system suggests a balanced leverage.
3️⃣ Market Volatility
In this signal, the market status is detected as Balanced.
In highly volatile markets, the system reduces leverage.
4️⃣ Signal Quality (Signal Score)
Scorecard:
58.34 / 100
Signals with average scores are usually suggested with conservative leverage.
Leverage Calculation Model
The ANAKO system uses a combined model to determine leverage:
-
Confidence
-
Risk
-
ATR
-
Stop Loss distance
-
Volatility
-
Market structure
This combination prevents users from using dangerous and unrealistic leverage.
Smart Position Calculator
This tool helps users calculate the appropriate trade volume.
The user only enters the following:
Capital
Risk percentage
Trade type
The system automatically calculates:
Position size
Margin
Liquidation price
Max loss
Compound Profit Analysis
This section is one of the most fascinating parts of the system.
Here, the system shows what happens if the capital grows in a compounded manner.
Example:
10 trades
+5%
50 trades
+32%
200 trades
+211%
This section shows the power of Compound Trading.
Suggested Trading Plan
One of the most important parts of this page is the complete trading plan.
This plan helps users know exactly how to enter a trade.
Step One: Preparation
Before entering a trade, it is best to complete these steps:
-
Study the signal analysis thoroughly
-
Check market conditions
-
Calculate trade volume using the Position Calculator
-
Be mentally prepared to take the risk of the trade
The market is not always predictable.
Step Two: Entering the Trade
This section specifies the exact entry details.
Entry Price:
$70,227
The order type can be one of the following:
Market Order
Limit Order
The trade direction is also specified:
LONG (Buy)
Be sure to set the Stop Loss before entering.
Step Three: Stop Loss
Stop Loss is the most important part of risk management.
In this example:
Stop Loss = $69,033
Some important rules:
-
Never remove the stop loss
-
Do not move the stop loss
-
If the price reaches the Stop Loss, immediately exit the trade
Step Four: Profit Taking
The system provides multiple price targets for taking profit.
Example:
TP1
$72,158
TP2
$73,351
TP3
$74,545
The best method is to take profits in stages.
Step Five: Margin Check
Before opening a trade, you must check:
Margin available
Liquidation distance
Important rule:
The liquidation price distance should be at least 50% greater than the Stop Loss distance.
Step Six: Trade Management
After opening the trade, you should monitor the market.
System suggestions:
-
Check the position status every 4 hours
-
Take partial profits after hitting each target
-
If the market moves against you, exit earlier than the SL
All Parameters Used in the Analysis
In the All Parameters Used section, all data used in the signal analysis are displayed.
Including:
Symbol
BTCUSDT
Timeframe
1H
Entry price
$70,227
Stop Loss
$69,033
Target levels
TP1 – TP3
Technical Indicators
The system uses several important indicators:
EMA 50
EMA 200
RSI
MACD
ATR
Example:
RSI
42.37
ATR
573.72
These indicators help the system identify the strength of the trend and market volatility.
Time-based target analysis
One of ANAKO’s special features is Time-Based Target Analysis.
In this section, the system estimates how much time it will take to reach the targets.
Example:
Estimated time to TP1
13h 1m
This estimate is calculated based on these factors:
-
ATR
-
Price movement speed
-
Market volatility
Conclusion
ANAKO signals are not just trade suggestions.
This system uses:
-
Artificial Intelligence
-
Technical Analysis
-
Smart Money
-
Risk Management
It provides users with a complete trading strategy.
By using these tools, users can manage their trades more professionally.
One very important point I must say bluntly.
90% of market signal websites only write:
Buy
TP
SLBut what you have built is a trading decision support system, not just signals.
If you present this properly in content and marketing, the ANAKO project can easily surpass most signal projects.
-