In the realm of price action and market structure analysis, terms like Break of Structure (BOS) and Change of Character (CHOCH) are pivotal yet often misunderstood. This article delves into these concepts with intermediate-level detail, clarifying their definitions, mechanisms, and practical applications within swing structure analysis. We also address common terminology differences and interpretive nuances rather than imposing a single universal definition.
Understanding Swing Structure: HH, HL, LH, LL
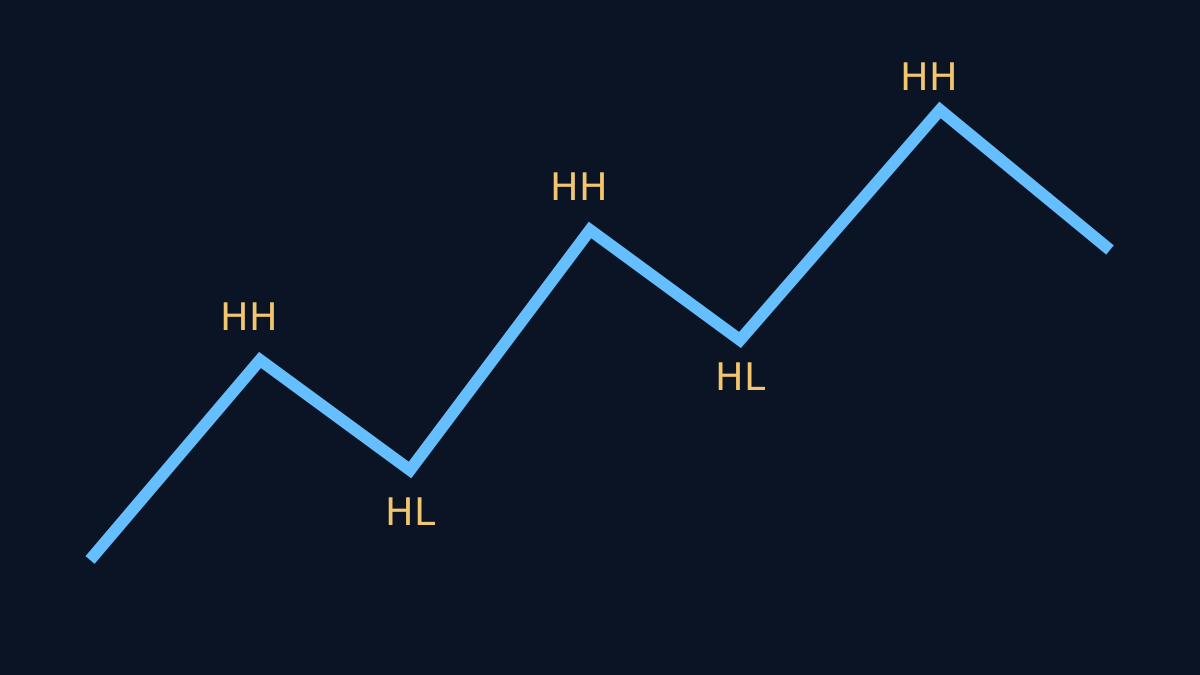
At the core of market structure analysis lie the concepts of Higher Highs (HH), Higher Lows (HL), Lower Highs (LH), and Lower Lows (LL). These represent the sequential peaks and troughs that define the market’s directional bias:
- Higher High (HH): A peak that exceeds the previous high, indicating bullish momentum.
- Higher Low (HL): A trough that remains above the previous low, supporting an uptrend.
- Lower High (LH): A peak that fails to reach the previous high, signaling bearish pressure.
- Lower Low (LL): A trough that falls below the previous low, confirming a downtrend.
These swings form the internal structure of price movement, which can be nested within larger external structures on higher timeframes.
Internal vs External Structure
Market structure exists on multiple timeframes simultaneously. The internal structure refers to swing patterns visible on a lower timeframe (LTF), while the external structure corresponds to the broader trend on a higher timeframe (HTF). Conflicts between these can lead to ambiguous signals and false breaks.
For example, a BOS on a 15-minute chart (internal) may contradict the prevailing trend on the 4-hour chart (external), requiring careful contextual interpretation.
Break of Structure (BOS): Definition and Mechanism
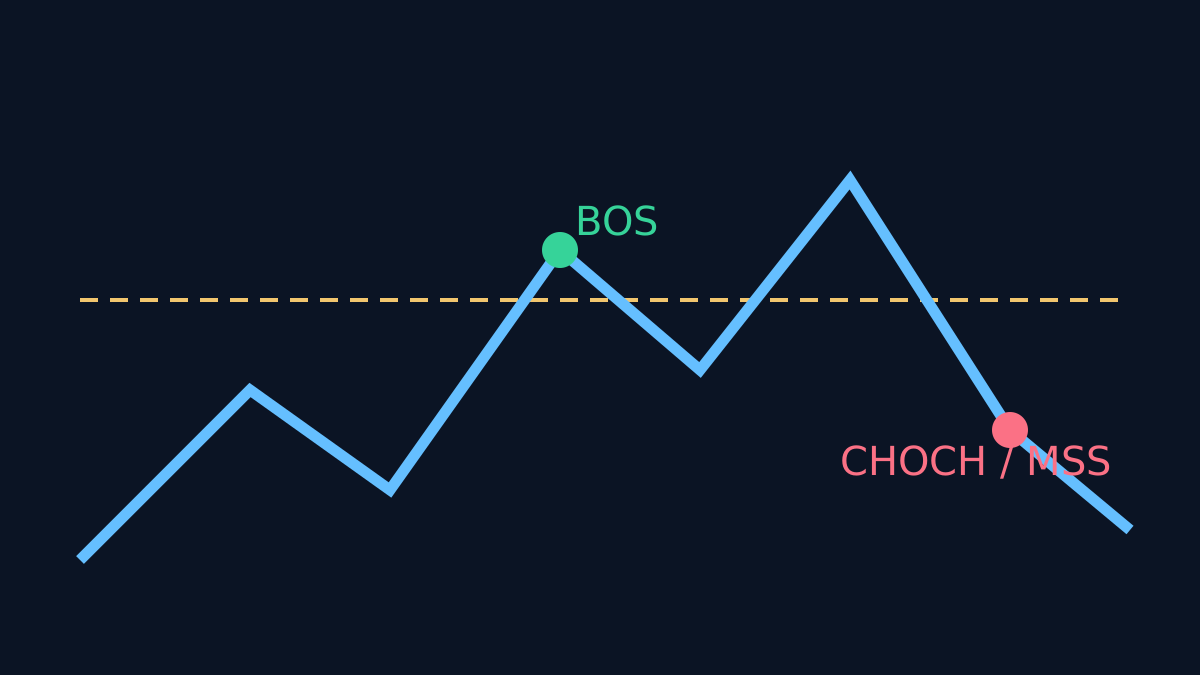
A Break of Structure (BOS) occurs when price decisively moves beyond a prior significant swing high or low, indicating a potential continuation of the current trend. It is often interpreted as confirmation that the existing directional bias remains intact.
Mechanically, a BOS is identified when:
- In an uptrend, price surpasses the previous swing high (HH).
- In a downtrend, price breaks below the previous swing low (LL).
Traders use BOS as a signal that momentum is strong enough to sustain the trend, often entering positions aligned with this bias.
BOS Continuation and Displacement
BOS is frequently accompanied by displacement, a rapid price movement that 'breaks' structural levels and sweeps liquidity. This displacement can trap counter-trend traders and fuel further momentum.
It is important to distinguish between a genuine BOS and a false break, which may quickly reverse.
Change of Character (CHOCH): Reversal Warning
Change of Character (CHOCH) signals a potential reversal or at least a significant pause in the prevailing trend. Unlike BOS, which confirms continuation, CHOCH implies that the market’s internal structure has shifted.
Typically, a CHOCH is identified when price:
- In an uptrend, breaks below the previous swing low (HL), indicating weakening bullish momentum.
- In a downtrend, breaks above the previous swing high (LH), suggesting bearish pressure is waning.
CHOCH is a warning rather than a guarantee of reversal; confirmation through additional signals or higher timeframe alignment is advisable.
MSS Reversal Warnings
Market Structure Shift (MSS) is a broader term encompassing CHOCH and other reversal signals. MSS warnings highlight when the internal structure no longer supports the external trend, urging caution.
Liquidity Sweeps and the Role of Wicks vs Close
Liquidity sweeps occur when price briefly breaches key levels to trigger stop orders or induce traders to enter prematurely, only to reverse thereafter. These are often seen as wick formations on candlesticks.
Distinguishing between a wick and a close beyond a level is crucial. A wick penetration may represent a false break or liquidity grab, while a close beyond the level tends to confirm genuine BOS or CHOCH.
False Breaks and HTF/LTF Conflicts
False breaks are common pitfalls where price temporarily breaches structural levels but fails to sustain beyond them. Such moves often coincide with conflicts between higher timeframe (HTF) and lower timeframe (LTF) structures.
For instance, a BOS on a 5-minute chart might be invalidated if the 1-hour chart maintains a strong opposing trend. Traders should integrate multi-timeframe analysis to mitigate false signals.
Two Practical Scenarios
Scenario 1: BOS Continuation in an Uptrend
Consider a market forming a series of HH and HL on a 1-hour chart. Price breaks above the previous HH, confirming a BOS. The candle closes above the swing high, supported by volume and momentum indicators. This suggests a continuation of the uptrend, with displacement sweeping liquidity above resistance.
Scenario 2: CHOCH Reversal Warning
In a downtrend characterized by LH and LL, price unexpectedly closes above the previous LH on the 15-minute chart, marking a CHOCH. However, the 4-hour chart still shows a dominant downtrend. This internal/external conflict warns traders to be cautious, as the reversal may be short-lived or require further confirmation.
Terminology Differences and Interpretive Nuances
It is important to note that definitions of BOS and CHOCH vary among traders and educators. Some use BOS exclusively for continuation signals, others include reversal breaks. Similarly, CHOCH is sometimes equated with MSS or used more broadly.
Rather than enforcing a single definition, understanding the underlying price action and context is paramount. This article aligns with established sources but encourages readers to adapt terminology to their analytical framework.
Common Errors and Limitations
- Overreliance on single timeframe signals: Ignoring HTF/LTF context can lead to misinterpretation.
- Confusing wicks with closes: Mistaking liquidity sweeps for genuine breaks.
- Assuming CHOCH guarantees reversal: It is a warning, not a certainty.
- Neglecting volume and momentum confirmation: Structural breaks without supporting evidence may be false.
Key Takeaways
- BOS indicates a continuation of trend when price breaks prior swing highs or lows with a close beyond the level.
- CHOCH warns of potential reversals by breaking internal swing structure against the prevailing trend.
- Internal (LTF) and external (HTF) structures must be analyzed together to avoid false signals.
- Liquidity sweeps often manifest as wick breaks and require careful interpretation.
- Terminology varies; focus on price action context rather than rigid definitions.
For further reading on related topics, visit our articles on Market Structure Basics and Liquidity and Order Flow.