Market structure forms the essential lens through which traders and analysts interpret price movements in financial markets. By dissecting price action into identifiable swing points and patterns, market structure helps in recognizing trends, ranges, and transitions, offering a more objective approach to chart reading beyond mere intuition.
Defining Market Structure Through Swing Points
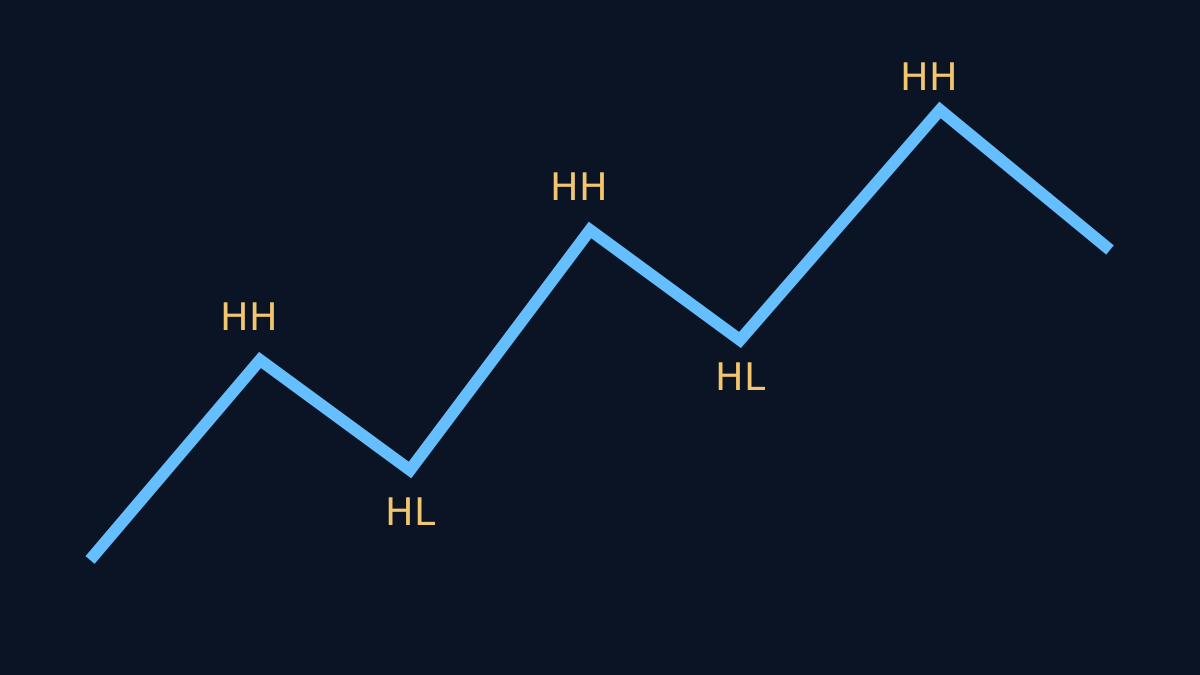
At its core, market structure is constructed from a sequence of swing points—local highs and lows that mark turning points in price action. These are categorized as:
- Higher Highs (HH): A peak higher than the previous high.
- Higher Lows (HL): A trough higher than the previous low.
- Lower Highs (LH): A peak lower than the previous high.
- Lower Lows (LL): A trough lower than the previous low.
These swing points form the building blocks of trends and ranges. For example, a sequence of HH and HL defines an uptrend, whereas LH and LL characterize a downtrend. When price oscillates without clear HH or LL formation, it often indicates a range-bound or sideways market.
Trend, Range, and Transition Phases
Understanding market phases is crucial for interpreting price behavior:
- Trend Phase: Characterized by consistent HH/HL (uptrend) or LH/LL (downtrend) formations.
- Range Phase: Price moves sideways, failing to break previous swing highs or lows decisively, resulting in overlapping highs and lows.
- Transition Phase: The market shifts from trend to range or vice versa, often marked by ambiguous swing points and increased volatility.
Recognizing these phases helps traders avoid misinterpreting temporary pullbacks as trend reversals or ignoring early signs of a trend change.
External vs. Internal Market Structure
Market structure can be analyzed on multiple levels:
- External Structure: The broader, higher timeframe (HTF) context that defines the dominant trend or range.
- Internal Structure: The lower timeframe (LTF) price action nested within the HTF, often showing micro-trends, pullbacks, or consolidations.
For example, a daily chart may show an uptrend (external structure), while the hourly chart reveals a temporary pullback or range (internal structure). Properly nesting HTF and LTF structures aids in aligning trades with the dominant market context.
Objective Swing Selection: Candle Close vs. Wick
Determining the exact swing points requires choosing between candle closes and wicks (highs/lows). This choice impacts the clarity and reliability of market structure:
- Candle Close: Using closes tends to filter out noise and false extremes, focusing on where price settled.
- Wick (High/Low): Incorporates the full price range, capturing liquidity hunts and stop runs but potentially increasing noise.
Many traders prefer candle closes for defining swing points to maintain objectivity, but wicks can provide valuable context in liquidity-sensitive environments.
Break of Structure (BOS) and Change of Character (CHOCH): Observations, Not Guarantees
Two key concepts in market structure analysis are:
- Break of Structure (BOS): When price decisively breaks a previous swing high or low, suggesting a potential trend continuation or reversal.
- Change of Character (CHOCH): A subtle shift in swing patterns indicating a possible transition from trend to range or vice versa.
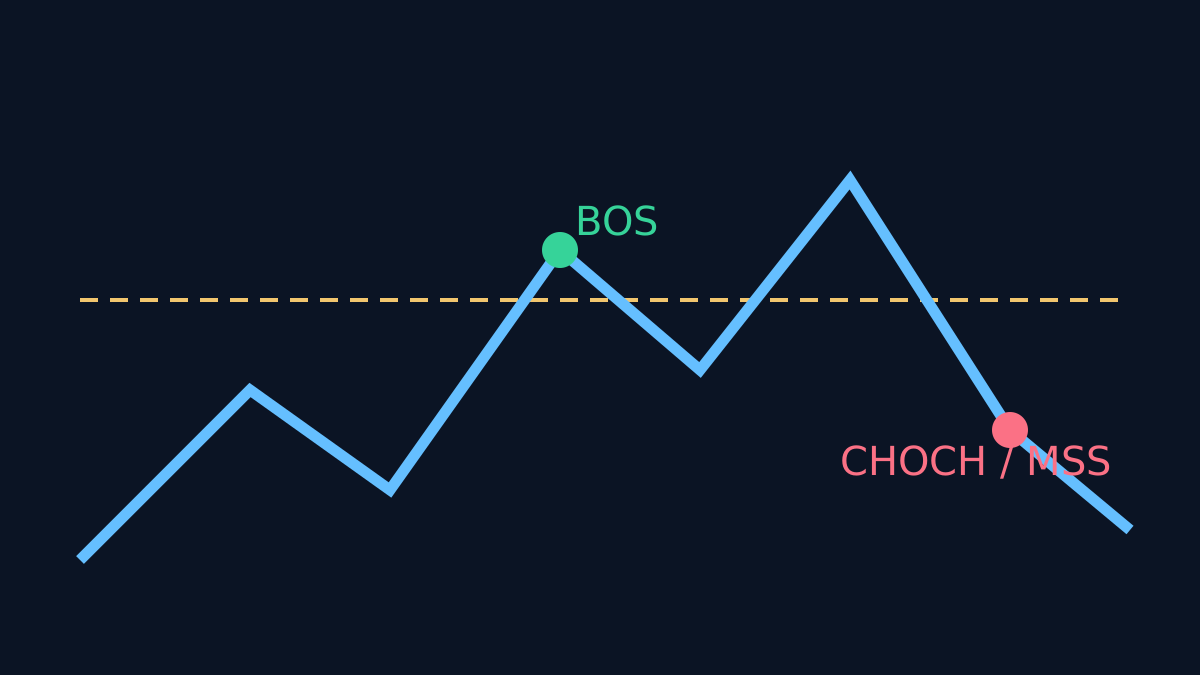
It is critical to understand that BOS and CHOCH are observations rather than definitive signals. They indicate a change in market behavior but do not guarantee sustained trend shifts. Traders should consider additional context, such as volume, liquidity zones, and higher timeframe structure, before drawing conclusions.
Liquidity Context and Market Structure
Liquidity plays a pivotal role in shaping market structure. Price often moves to areas of concentrated orders—stop losses, limit orders, or institutional entry points—creating liquidity pools that influence swing points.
For instance, wicks beyond previous highs or lows may represent liquidity grabs, where price temporarily violates swing points to trigger stops before reversing. Recognizing these liquidity dynamics helps differentiate between genuine structure breaks and false signals.
Annotated Hypothetical Sequences
Consider two hypothetical price sequences illustrating market structure nuances:
Sequence A: Clear Uptrend with BOS
- Price forms HL and HH consistently.
- A BOS occurs when price breaks above the previous HH.
- Subsequent pullbacks respect prior HLs, confirming trend strength.
Sequence B: Ambiguous Transition with CHOCH
- Price forms HH and HL initially.
- Price fails to make a new HH and instead forms an LH.
- CHOCH is observed as the swing pattern shifts, but price remains within a range.
- False BOS attempts occur, leading to potential trader confusion.
These sequences highlight the importance of patience and context when interpreting market structure.
Ambiguity and Failure Cases
Market structure analysis is not infallible. Common pitfalls include:
- False Breakouts: Price temporarily breaches swing points without confirming a new trend.
- Whipsaws: Rapid reversals that invalidate recent BOS or CHOCH observations.
- Overreliance on Single Timeframe: Ignoring HTF context can lead to misreading internal structure.
Traders should combine market structure with other analytical tools and maintain flexibility to adapt to evolving price behavior.
Further Reading
For a deeper dive into related concepts, explore our articles on Liquidity in Trading and Timeframe Nesting in Market Analysis.