Inflation is a fundamental economic concept that affects everyday life, from grocery bills to mortgage rates. Central to understanding inflation is the Consumer Price Index (CPI), a key statistical measure used to track changes in the price level of a basket of goods and services over time. This article provides a clear, beginner-friendly explanation of CPI, its components, measurement nuances, and how inflation data interacts with financial markets.
What Is the Consumer Price Index (CPI)?
The CPI measures the average change over time in the prices paid by urban consumers for a market basket of consumer goods and services. It is published monthly by the U.S. Bureau of Labor Statistics (BLS) and serves as a primary gauge of inflation in the economy. The CPI reflects price changes for a wide variety of items, including food, housing, clothing, transportation, medical care, and recreation.
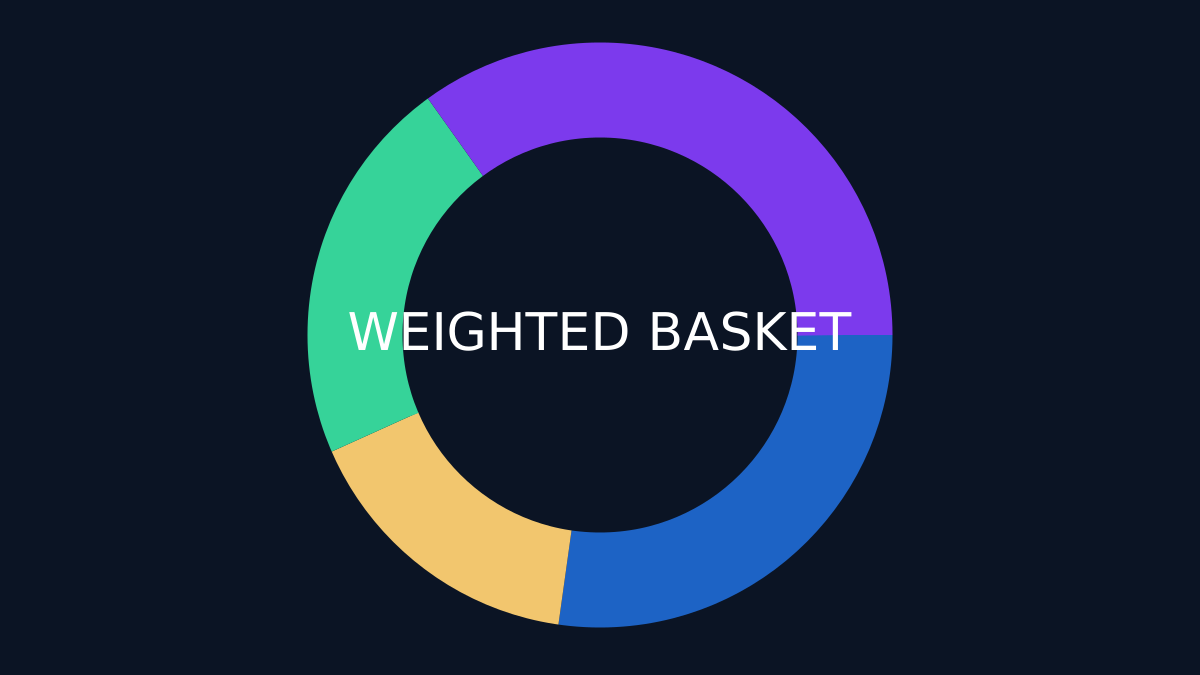
The CPI basket is weighted to reflect the relative importance of each category in the average consumer’s spending. For example, shelter costs typically carry the largest weight because housing expenses represent a significant portion of household budgets. Energy and food are also important components, but their weights are smaller compared to shelter.
Headline vs. Core CPI
Headline CPI includes all components, such as food and energy prices, which tend to be more volatile. Core CPI excludes food and energy to provide a measure of underlying inflation trends by filtering out short-term price shocks. Policymakers and analysts often focus on core CPI to assess persistent inflation pressures.
Monthly (MoM) vs. Yearly (YoY) Changes
CPI data can be reported as month-over-month (MoM) or year-over-year (YoY) changes. MoM changes compare the current month’s prices to the previous month, capturing short-term price movements. YoY changes compare prices to the same month in the previous year, smoothing out seasonal effects and providing a longer-term perspective on inflation trends.
Key Components of the CPI
The CPI basket is divided into categories that reflect different consumer expenditures:
- Shelter: Includes rent, owners’ equivalent rent, and lodging away from home. Shelter is the largest single component and heavily influences overall CPI movements.
- Energy: Covers gasoline, fuel oil, electricity, and other fuels. Energy prices can be highly volatile due to geopolitical events and supply-demand imbalances.
- Goods: Encompasses durable goods (e.g., appliances, cars) and nondurable goods (e.g., clothing, food).
- Services: Includes healthcare, education, transportation services, and recreation.
Weights and Their Importance
Each category’s weight in the CPI basket is based on expenditure data from surveys such as the Consumer Expenditure Survey. These weights are updated periodically to reflect changing consumer habits. Because of these weights, price changes in heavily weighted categories like shelter have a larger impact on the overall CPI than changes in less weighted categories.
Adjustments and Revisions in CPI Data
Seasonal Adjustment
Seasonal adjustment removes predictable seasonal patterns in prices, such as holiday sales or heating costs in winter, to reveal the underlying inflation trend. This adjustment helps analysts compare inflation rates across months without distortion from seasonal factors.
Base Effects
Base effects occur when inflation rates appear unusually high or low due to the comparison with a prior period that had atypical price levels. For example, if prices fell sharply a year ago, the current YoY inflation rate may appear elevated even if recent price increases are moderate.
Revisions
Initial CPI estimates may be revised as more complete data becomes available. These revisions can affect the interpretation of inflation trends, underscoring the importance of considering updated releases.
Price Level vs. Inflation Rate
The CPI measures the price level—the average price of the basket at a point in time. Inflation is the rate of change of that price level over a period, typically expressed as a percentage. Understanding this distinction is crucial: a rising price level indicates inflation, but the inflation rate quantifies how fast prices are increasing.
How Inflation Data Influences Financial Markets
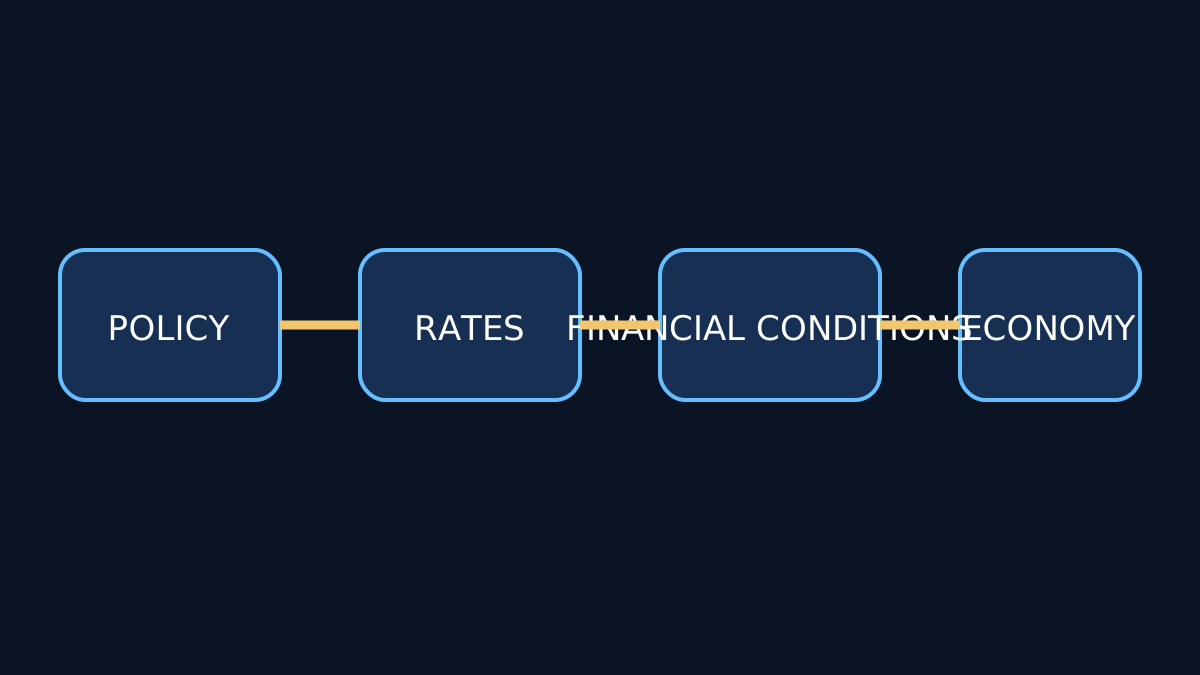
Consensus expectations for CPI releases play a central role in financial market dynamics. Market participants form forecasts based on economic models and surveys, and actual CPI data compared to these expectations can lead to market adjustments.
Transmission Mechanisms
- Yields: Higher-than-expected inflation often leads to rising bond yields as investors demand compensation for eroding purchasing power.
- US Dollar (USD): Inflation surprises can strengthen or weaken the USD depending on expectations for monetary policy responses.
- Gold: Often viewed as an inflation hedge, gold prices may rise when inflation concerns increase.
- Risk Assets: Stocks and other risk assets may react variably depending on whether inflation is seen as transitory or persistent and the anticipated policy response.
It is important to note that these market reactions are conditional and influenced by broader economic context, central bank policy, and investor sentiment.
Common Misunderstandings and Limitations
Some common errors in interpreting CPI and inflation include:
- Confusing price level with inflation rate.
- Overemphasizing headline CPI without considering core inflation.
- Ignoring base effects that can distort YoY comparisons.
- Assuming immediate and uniform market reactions to inflation data.
Moreover, CPI does not capture every aspect of inflation experienced by all consumers, as spending patterns vary across demographics and regions.
Further Learning
For a deeper dive into inflation and its economic implications, explore our related articles on Inflation Basics and Monetary Policy and Inflation.
Key Takeaways
- The CPI measures changes in the average price level of a fixed basket of goods and services, weighted by consumer spending.
- Headline CPI includes all items; core CPI excludes volatile food and energy prices to show underlying inflation.
- Monthly and yearly CPI changes provide different perspectives on inflation trends.
- Seasonal adjustment and base effects are important for accurate interpretation of CPI data.
- Inflation data influences financial markets through yields, currency, gold, and risk assets, but reactions depend on broader context.