Liquidity is a cornerstone concept in financial markets, influencing price discovery, volatility, and trade execution. It refers to the ease with which assets can be bought or sold without causing significant price changes. However, liquidity is not uniform; it varies across buy-side and sell-side participants, price levels, and trading sessions. This article delves into the mechanics of liquidity, key market structures, and the terminology traders use to describe liquidity events.
Buy-Side and Sell-Side Liquidity
Buy-side liquidity represents the availability of buyers willing to purchase an asset at or near current market prices. Conversely, sell-side liquidity reflects the presence of sellers ready to offload their holdings. The balance between these two sides determines market depth and price stability.
For example, if there is abundant buy-side liquidity but limited sell-side liquidity, prices may rise rapidly as buyers compete for scarce supply. Conversely, excess sell-side liquidity with few buyers can drive prices down.
Key Price Levels: Equal and Previous Highs/Lows
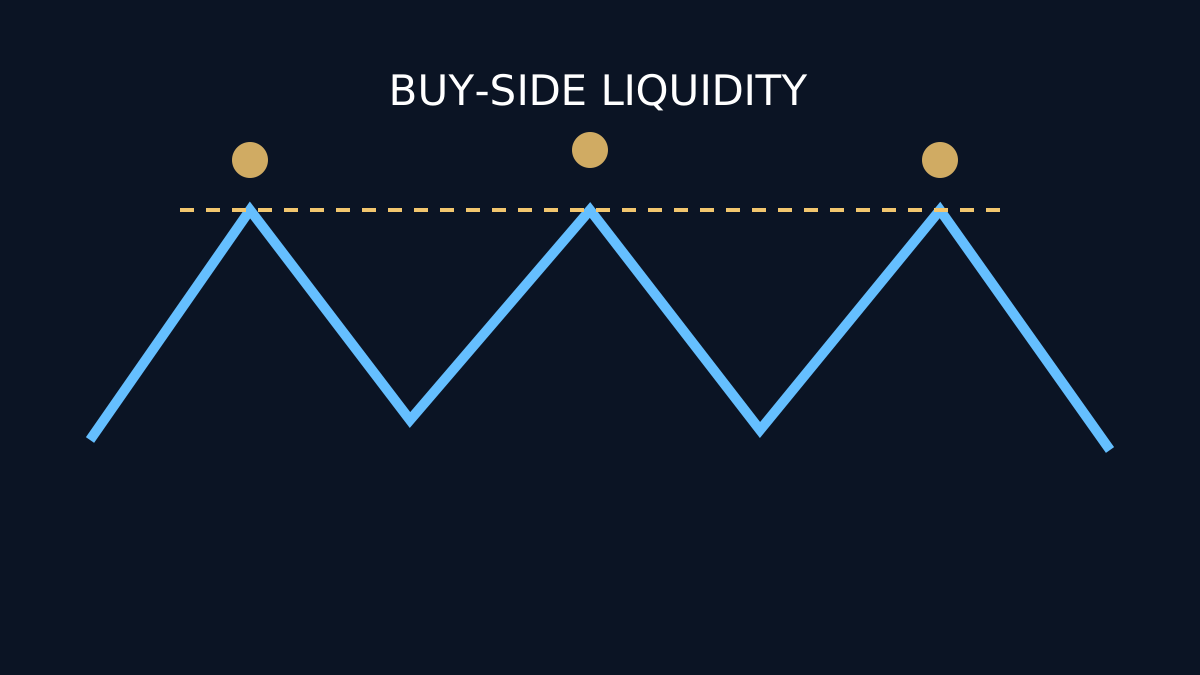
Traders often focus on equal highs and lows—price points where the market has previously reversed or stalled. These levels act as natural liquidity pools because many stop orders and limit orders cluster around them.
Previous highs and lows from earlier sessions also serve as reference points. Market participants watch these levels closely, anticipating reactions such as breakouts or reversals.
Session Extremes and Stop Pools
Session extremes—the highest and lowest prices reached during a trading session—are critical liquidity zones. These extremes often contain clusters of stop-loss orders, known as stop pools. When price approaches these areas, it can trigger cascades of stops, causing rapid price movements.
For instance, a sell-side stop pool below a session low may be targeted by aggressive buyers aiming to induce a liquidity grab before pushing prices higher.
Inducement: Drawing Out Liquidity
Inducement refers to tactics used by larger market participants to lure smaller traders into placing orders at vulnerable price levels. By creating false impressions of market direction, inducement helps the larger players access liquidity pools—particularly stop pools—at advantageous prices.
For example, a brief price dip below a previous low may induce stop-loss orders, which are then absorbed by larger buyers initiating a reversal.
Sweep, Raid, and Grab: Liquidity Hunting Terminology
These terms describe different methods of liquidity extraction:
- Sweep: A rapid price move through multiple liquidity levels, triggering stops and limit orders in succession.
- Raid: An aggressive attack on a specific liquidity zone, often a stop pool, to trigger a cascade of orders.
- Grab: A quick test or poke into a liquidity area to collect orders without sustained movement.
Continuation versus Reversal Patterns
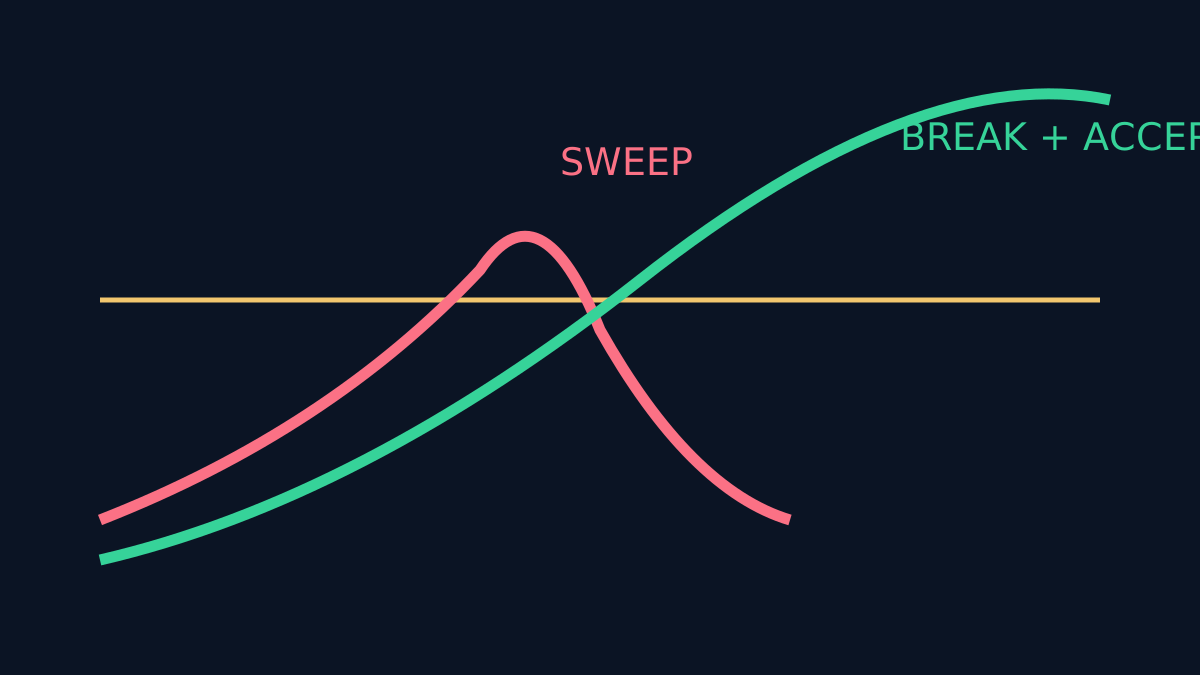
Understanding whether liquidity hunts lead to continuation or reversal is vital. A continuation occurs when liquidity extraction confirms the prevailing trend, enabling momentum to persist. A reversal happens when liquidity is absorbed and the market changes direction.
For example, a sweep through a stop pool followed by strong buying may signal continuation, while a failed sweep that quickly retraces could indicate a reversal.
MSS, BOS, FVG, and OB: Market Structure Relationships
Several technical concepts relate closely to liquidity:
- MSS (Market Structure Shift): A change in trend direction, often coinciding with liquidity absorption.
- BOS (Break of Structure): When price breaks a key high or low, potentially triggering liquidity hunts.
- FVG (Fair Value Gap): Price inefficiencies or gaps that can attract liquidity as the market seeks equilibrium.
- OB (Order Block): Areas where large orders were previously executed, often acting as liquidity magnets.
Recognizing how these elements interact helps traders anticipate liquidity events and price reactions.
Execution Limits and False Certainty
Traders must be cautious of execution limits—constraints on order size or price—that can create illusions of liquidity. Similarly, false certainty arises when traders overinterpret signals, mistaking temporary liquidity hunts for definitive trend changes.
For example, a small sweep triggering stops might appear as a breakout, but without sufficient follow-through, it may be a false signal.
Common Errors and Limitations
Misreading liquidity zones or ignoring the context of market structure can lead to poor decisions. Overreliance on stop pools without confirming broader trends risks falling victim to inducement. Additionally, liquidity dynamics vary across asset classes and timeframes, requiring adaptable strategies.
Key Takeaways
- Liquidity consists of buy-side and sell-side orders clustered at key price levels like equal highs/lows and session extremes.
- Stop pools are critical liquidity zones targeted by inducement tactics such as sweeps, raids, and grabs.
- Distinguishing continuation from reversal after liquidity hunts depends on market structure and order flow context.
- MSS, BOS, FVG, and OB concepts help interpret liquidity events and anticipate price behavior.
- Be wary of execution limits and false certainty; always consider liquidity within broader market dynamics.
For a deeper understanding of market structure and liquidity, see our related articles on Market Structure Basics and Order Block Strategies.