In financial trading and portfolio management, drawdown is a critical concept that quantifies the decline in an investment’s value from a historical peak to a subsequent trough. It provides insight into the risk profile and resilience of a strategy or account, helping traders and investors understand potential losses and recovery challenges.
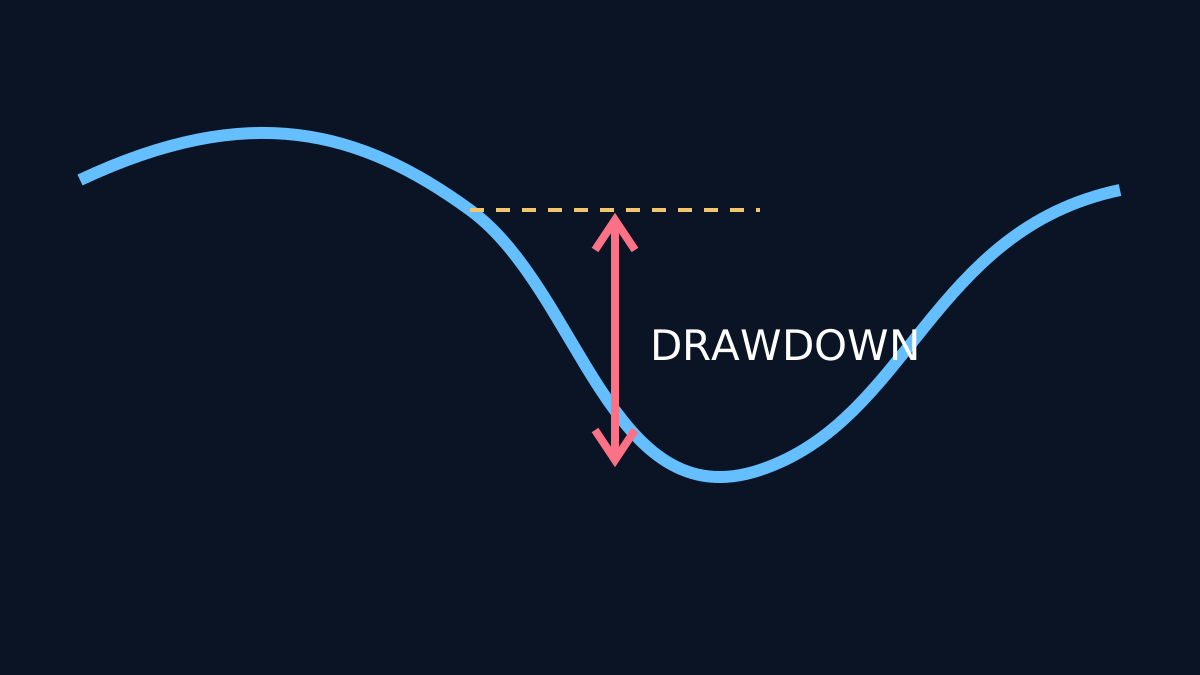
Defining Drawdown: Peak-to-Trough Decline
Drawdown is formally defined as the percentage decline from the highest historical value (peak) to the lowest subsequent value (trough) before a new peak is attained. Mathematically, if P is the peak value and T is the trough value, the drawdown D is:
D = (P - T) / P × 100%
This measurement captures the worst loss an investor would have experienced if they had bought at the peak and sold at the trough.
Current vs Maximum Drawdown
Current drawdown refers to the ongoing decline from the most recent peak to the current value, whereas maximum drawdown (Max DD) is the largest peak-to-trough decline observed over a specified period. Max DD is a key risk metric used to assess the worst-case historical loss scenario for a strategy or portfolio.
Balance vs Equity Curves
Understanding drawdown requires distinguishing between balance and equity curves:
- Balance curve tracks the account value excluding unrealized profits or losses.
- Equity curve includes unrealized gains and losses, reflecting the real-time value of the portfolio.
Drawdowns calculated on equity curves can be more volatile due to fluctuating open positions, while balance curve drawdowns reflect closed trade results only. Traders often monitor both to gauge risk exposure accurately.
Percentage Arithmetic and Recovery Asymmetry
Drawdown percentages are intuitive but asymmetric when considering recovery. For example, a 50% drawdown requires a 100% gain to return to the original peak. This asymmetry highlights the nonlinear challenge of recovering from losses, emphasizing the importance of limiting drawdowns.
Losing Streaks and Path Dependence
Drawdown is inherently path dependent, meaning the sequence of returns affects the magnitude and duration of drawdowns. Extended losing streaks can deepen drawdowns and delay recovery, even if the overall strategy remains profitable in the long term.
For instance, two strategies with identical average returns can have vastly different drawdown profiles depending on the order and clustering of losses.
Leverage and Correlation Effects
Leverage amplifies drawdowns by increasing exposure relative to capital, magnifying both gains and losses. Similarly, correlation between assets or strategies influences portfolio drawdowns; high correlation can exacerbate drawdowns during market downturns, while diversification can mitigate them.
Strategy vs Account Drawdown
It is crucial to differentiate between strategy drawdown and account drawdown. Strategy drawdown measures the performance decline of a single trading system, whereas account drawdown reflects the combined effect of all strategies and cash flows in the account.
Understanding this distinction helps in risk attribution and in setting appropriate risk limits.
Rolling Windows and Risk Limits
Drawdowns are often analyzed over rolling windows (e.g., 1 year, 3 years) to assess recent risk trends. This approach helps identify changes in strategy behavior or market conditions that may increase risk.
Risk limits based on maximum acceptable drawdown thresholds are common in portfolio management to prevent catastrophic losses and enforce discipline.
Operational Responses to Drawdown
When drawdowns occur, traders and managers may respond by:
- Reducing position sizes or leverage to limit further losses.
- Pausing or stopping trading to reassess strategy viability.
- Adjusting risk parameters or diversifying to mitigate future drawdowns.
Such operational controls are essential to preserve capital and maintain psychological resilience.
Limitations of Drawdown as a Quality Metric
While drawdown is a vital risk indicator, relying on it exclusively can be misleading. It does not capture the frequency or duration of losses, nor does it reflect the risk-adjusted return profile fully. Other metrics such as Sharpe ratio, volatility, and loss duration complement drawdown analysis for a holistic evaluation.
Moreover, drawdown does not predict future risk but rather describes historical worst-case scenarios, which may not recur identically.
Key Takeaways
- Drawdown measures peak-to-trough declines, providing insight into potential losses and recovery challenges.
- Current and maximum drawdowns are distinct but complementary metrics.
- Equity and balance curves offer different perspectives on drawdown risk.
- Recovery from drawdowns is nonlinear and path dependent, influenced by losing streaks and leverage.
- Drawdown alone is insufficient; it should be combined with other risk and performance metrics.
For further reading on related risk metrics and portfolio management techniques, see our articles on risk management principles and portfolio diversification.