In financial trading, the risk-to-reward ratio is a fundamental concept that helps traders plan and evaluate potential trades. It compares the potential loss (risk) against the potential gain (reward) of a trade, guiding decisions on entry, stop-loss, and target levels. However, understanding this ratio goes beyond simple division; it involves integrating concepts like R-multiples, expectancy, hit-rate, execution costs, and market realities.
What Is the Risk-to-Reward Ratio?
The risk-to-reward ratio quantifies how much a trader stands to lose relative to the potential profit. For example, a ratio of 1:3 means risking 1 unit of currency to potentially gain 3 units. This ratio is usually planned before entering a trade by setting a stop-loss (risk) and a profit target (reward).
Planned Risk and Reward
Planned risk is the distance between the entry price and the stop-loss level, representing the maximum loss if the trade moves unfavorably. Planned reward is the distance between the entry price and the target price, representing the potential profit if the trade reaches the target.
Both distances are often expressed in price units or ticks. The ratio of these distances gives the planned risk-to-reward ratio, which helps traders assess if a trade is worth taking.
R-Multiples: A Standardized Measure
R-multiples simplify risk and reward into multiples of the initial risk unit, R. If R is the amount risked, then a reward equal to 3 times the risk is 3R. This standardization allows traders to compare trades of different sizes and instruments on a common scale.
For example, if a trader risks $100 (R=100), a target of $300 profit corresponds to 3R. If the trade hits the target, the trader gains +3R; if stopped out, the loss is -1R.
Expectancy and Hit-Rate: The Interaction
While the risk-to-reward ratio is important, it must be considered alongside the hit-rate (percentage of winning trades) and expectancy (average return per trade). Expectancy is calculated as:
Expectancy = (Hit-Rate × Average Win) − (Loss-Rate × Average Loss)
Here, the average win and loss are expressed in R-multiples. A trade with a high reward but very low hit-rate may have a lower expectancy than a trade with a moderate reward and higher hit-rate.
Example
Consider two strategies:
- Strategy A: Risk-to-reward 1:3, hit-rate 30%
- Strategy B: Risk-to-reward 1:1, hit-rate 60%
Calculating expectancy:
- Strategy A: (0.3 × 3R) − (0.7 × 1R) = 0.9R − 0.7R = 0.2R
- Strategy B: (0.6 × 1R) − (0.4 × 1R) = 0.6R − 0.4R = 0.2R
Both have the same expectancy, illustrating that risk-to-reward ratio alone does not determine profitability.
Stop and Target Distance: Setting Realistic Levels
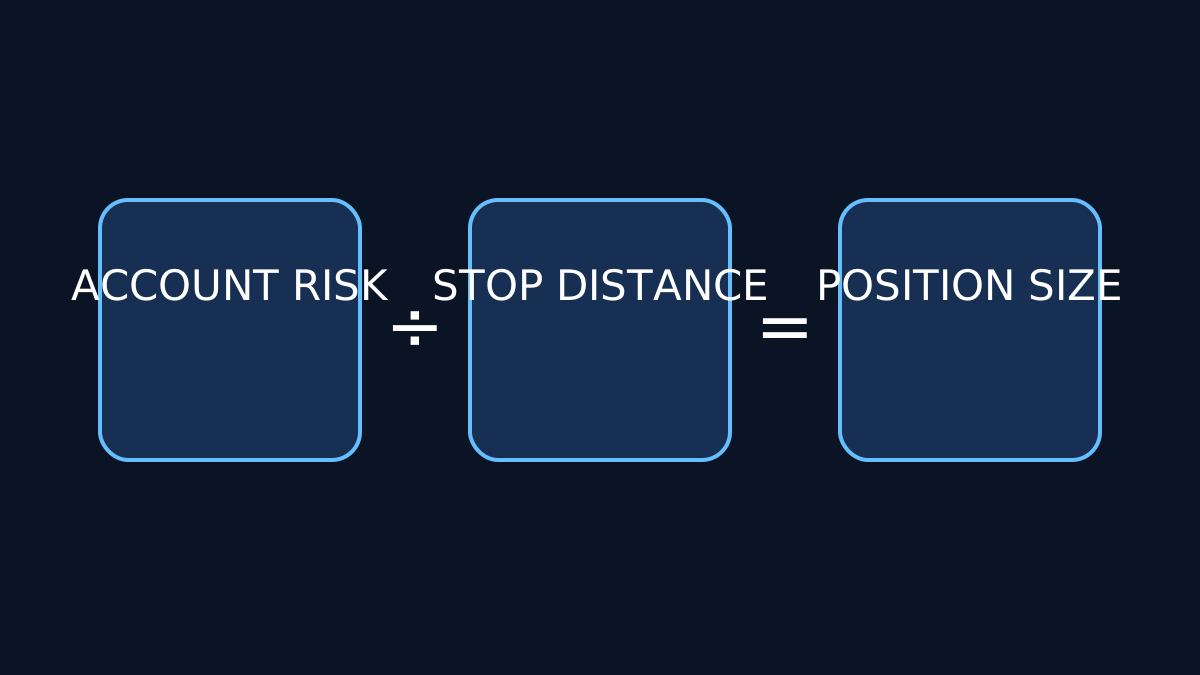
Stop-loss and target distances must reflect realistic market structure and volatility. Setting stops too tight may lead to premature exits, while overly distant stops increase risk and reduce the risk-to-reward ratio.
Targets should be set at logical levels such as support/resistance zones or measured moves, not arbitrarily far to inflate the reward.
Execution Costs and Their Impact
Commissions, spreads, and slippage reduce net profits and increase effective risk. These costs should be factored into the risk-to-reward calculation to avoid overestimating potential gains.
For example, if the spread is large relative to the stop distance, the effective risk is higher than planned, reducing the actual reward-to-risk ratio.
Partial Exits and Multiple Targets
Traders sometimes use partial exits to lock in profits incrementally, reducing risk as the trade progresses. This approach can alter the realized risk-to-reward ratio compared to the planned ratio.
Multiple targets allow capturing gains at different levels, which can improve expectancy but complicate the calculation of a single risk-to-reward ratio.
Break-Even Moves and Market Structure
Moving the stop-loss to break-even after a certain profit level is a common risk management technique. While it protects capital, it may also reduce the potential reward and alter the risk-to-reward profile.
Understanding realistic market structure—such as volatility, support/resistance, and typical price swings—is crucial for setting meaningful stops and targets.
Planned vs. Realized R
The planned R is the theoretical risk-to-reward ratio before entering the trade. The realized R is the actual outcome after the trade closes, which may differ due to partial exits, slippage, or early stop adjustments.
Tracking realized R over many trades helps evaluate the effectiveness of the trading plan.
Misleading Attractive Ratios
High risk-to-reward ratios may appear attractive but can be misleading if the hit-rate is very low or if targets are unrealistic. Conversely, low ratios with high hit-rates can be profitable.
Beware of strategies that promise large rewards but rarely hit targets, as they may have negative expectancy once costs and realistic execution are considered.
Worked Hypothetical Comparison
Imagine two trades with the same risk ($100):
- Trade 1: Target $300 (3R), stop $100 (1R), hit-rate 25%
- Trade 2: Target $150 (1.5R), stop $100 (1R), hit-rate 50%
Expectancy calculations:
- Trade 1: (0.25 × 3R) − (0.75 × 1R) = 0.75R − 0.75R = 0
- Trade 2: (0.5 × 1.5R) − (0.5 × 1R) = 0.75R − 0.5R = 0.25R
Despite the lower reward, Trade 2 has a better expectancy, highlighting the importance of combining risk-to-reward ratio with hit-rate and realistic targets.
Common Errors to Avoid
- Ignoring execution costs in calculations.
- Setting stops or targets without regard to market structure.
- Relying solely on risk-to-reward ratio without considering hit-rate and expectancy.
- Failing to track realized R and adjusting plans accordingly.
Conclusion
The risk-to-reward ratio is a valuable tool for trade planning but must be integrated with other factors like hit-rate, expectancy, execution costs, and realistic market conditions. Understanding the difference between planned and realized R, and avoiding misleading ratios, helps traders develop robust strategies.
For further insights, explore our detailed articles on trade expectancy and position sizing.
Key Takeaways
- The risk-to-reward ratio compares potential loss to potential gain and guides trade planning.
- R-multiples standardize risk and reward, facilitating comparison across trades.
- Hit-rate and expectancy are crucial to assess the profitability of a risk-to-reward setup.
- Execution costs and realistic stop/target placement affect actual outcomes.
- Partial exits, break-even stops, and market structure influence realized risk-to-reward.
- Beware of misleading ratios; combine multiple metrics for sound decision-making.